Below is a listing of science images which took a very long time to compile. If you use any of the images please link back to this page.
Use your browsers text search feature to find keywords you are looking for. Example: CTRL+F
- Loosely Packed Sediment Samples Water was poured slowly into four cups containing equal volumes of loosely packed sediment samples
- Rates Of Erosion In Regions Of Different Relief Each dot on the graph below shows the result of separate scientific studies of the relationship between the rates of erosion in regions of different relief. Relief is the local difference between the highest and the lowest elevations.
- Layers Of Soil Layers of soil
- Change In The Elevation Shows the average change in the elevation of a mountain range over time.
- Geological Feature Geological feature in the Kalahari Desert of southwestern Africa.
- Sediment-laden River Flowing Into The Ocean The arrows show the direction of river flow. Different zones of sorted sediments, A, B, C, and D, have been labeled. Sediments have been taken from these zones and measured. The data table shows the range of sediment sizes in each zone.
- Settling Tube Which shows a clear plastic tube containing water and a beaker containing a mixture of rounded quartz grains of different sizes.
- Stream Depoaition Normal pattern of sediments deposited where a stream enters a lake. Letter X represents a particular type of sediment.
- Soil Profile Soil Profile
- Sediment Columns The columns A, B, C, and D shown below contain equal volumes of sediment.
- Tombstone Weathering Show dates on tombstones found in a cemetery in St. Remy, New York. The tombstones were 5 meters apart and both faced north. Tombstone A had dates cut into the rock in 1922. Tombstone B had dates cut into the rock in 1892.
- Three Types Of Streams Block diagrams below, which show three types of streams with equal volumes.
- Wind Driven Sand Particles Shows the movement of wind-driven sand particles that strike a partly exposed basalt cobble located at the surface of a windy desert.
- Stream Drainage Pattern Map view of a stream drainage pattern.
- Water erosion Undercutting and erosion of softer rock material underneath caused by running water.
- erosion along SR 105 at Wash-away Beach WSDOT maintenance crews place large rock to help prevent further.
- Tide erosion along SR 112 near Neah Bay Tide erosion along SR 112 near Neah Bay
- soil movement An indication of the extent of soil movement in the area.
- SR 107 roadway surface Buckling of the roadway.
- Land Movement Evidence Curved trunk of a tree due to local soil slump
- Land Movement Evidence Curved trunk of a trees due to local soil slump
- Glaciation Map displaying southern extent of last glaciation
- Long Island Glaciation Zoomed in map displayed southern extent of last glaciation
- Mass Movement Remnant of a large soil slide
- Mass Movement Remnant of a large soil slide
- physical weathering great shot showing the root of a large tree physically weather local bedrock
- sediment transport Rocks transported via river
- Taughannock Nice waterfall shot showing sediment transport
- Rock Under Cutting Nice shot showing the softer sub rock layer which has been eroded away by running water. Harder top layer remains uneffected by water
- Rock Under Cutting Nice shot showing the softer sub rock layer which has been eroded away by running water. Harder top layer remains uneffected by water
- Rock Under Cutting Nice shot showing the softer sub rock layer which has been eroded away by running water. Harder top layer remains uneffected by water
- Waterfall Layer Erosion Shows how powerful water can be
- Lake Mead Aerial shot of the Hoover Dam's Lake Mead.
- Lake Mead
- Bulldozer Mining Small mine in the mid west with active bulldozers.
- Mine Small little mining operation in the Nevada desert.
- Mine Small little mining operation in the Nevada desert.
- Old Gold Mine This is the entrance to an old gold mine. The ropes are there for safety to prevent people from falling in.
- Colorado River An aerial view of the Colorado River.
- Colorado River and Grand Canyon Aerial shot of the Colorado River and the Grand Canyon as the background.
- Helicopter View of Lake Mead Aerial shot of the Hoover Dam's Lake Mead.
- Lake Mead Drought Great shot showing the decreased water level of Lake Mead. The white rim is where the water used to be but due to limited rainfall and excessive farming, water level of Lake Mead has dropped.
- Colorado River An aerial view of the Colorado River.
- Gold Mine Zoomed image of the entrance to a now defunct gold mine in the mid west US
- Meandering stream Shows a meandering stream as it enters a lake. The arrow shows the direction of stream flow. Points A through D represent locations on the surface of the stream.
- water flowing out of a well Shows water flowing out of a well drilled through tilted sedimentary bedrock. Point A represents a location on Earth’s surface.
- Glacier moving down a mountain valley The cross section, which represents a glacier moving down a mountain valley. The water from the melting glacier is flowing into a lake. Letter A represents a location on the bottom of the lake.
- Overhead view of sediments The map shows an overhead view of sediments that have accumulated at the bottom of a lake. Points A through D represent locations on the shoreline of the lake.
- block diagram The diagram is of the Niagara Falls region as viewed from the north.
- glacial landscape feature shows a glacial landscape feature forming over time from a melting block of ice
- stream table shows a laboratory stream table. A mixture of sediment was placed on the stream table. A short time after the faucet was turned on, a deposit of sediment began forming at location X at the lower end of the stream table.
- River Block Diagram represents the landscape features associated with a meandering stream. WX is the location of a cross section. Location A indicates a landscape feature.
- Felsic Igneous Rock The diagram represents a felsic igneous rock. Letters A, B, and C represent three different minerals in the rock sample. The table describes the physical properties of minerals A, B, and C found in the igneous rock sample.
- Arrangement Of Minerals Two magnified views showing the arrangement of minerals before and after metamorphism of rock C.
- Coal Formation Sequence of diagrams below shows how coal is formed.
- Halite Shows a piece of halite that has been recently broken.
- Gas Pockets In Glass Gas pockets in glass
- Cooling Time Graph Shows the relationship between the cooling time of magma and the size of the crystals produced.
- Calcite Broken piece of the mineral calcite
- Cleavage Photograph shows several broken samples of the same colorless mineral.
- Gneiss Foliated texture and contains the minerals amphibole, quartz, and feldspar arranged in coarse-grained bands.
- Crystal Sizes In A Light-colored Igneous Rock Shows actual crystal sizes in a light-colored igneous rock that contains several minerals, including potassium feldspar, quartz, and biotite mica
- Inferred Metamorphism Of Shale Shows a generalized sequence of rock types that form from original clay deposits at certain depths and temperature conditions within Earth’s interior.
- Industrial Uses Of Wollastonite In The United States Shows the industrial uses of wollastonite, a mineral mined in the eastern Adirondack Mountains of New York State
- Large Intergrown Crystals Large intergrown crystals
- Mica Crystals In Foliated Layers Mica crystals in foliated layers
- Magnified Block Shaped Sandstone Samples Four magnified block-shaped sandstone samples labeled A, B, C, and D. Each sandstone sample contains quartz grains of different shapes and sizes. The quartz grains are held together by hematite cement.
- Photographs Of Herkimer Diamonds (Quartz) Photographs of “Herkimer Diamonds†(Quartz)
- Moh’s Scale Of Hardness Lists the minerals in Moh’s Scale of Hardness from 1 (softest) to 10 (hardest).
- Pegmatite Rock Photograph below shows the intergrown crystals of a pegmatite rock.
- Pebbles Cemented In Sand Matrix Pebbles cemented in sand matrix
- Pegmatite Rock Photograph below shows the intergrown crystals of a pegmatite rock.
- Weathering Of Igneous Rock Shows igneous rock that has undergone mainly physical weathering into sand and mainly chemical weathering into clay.
- Rock Classification Flowchart Rock Classification Flowchart
- Rock Shows a rock with deformed structure and intergrown crystals
- Sedimentary Rock Sample Sedimentary rock sample
- Structure Of Kaolinite Represents a part of the crystal structure of the mineral kaolinite.
- metaconglomerate This sample of metaconglomerate shows the flattened, stretched pebbles characteristic of this rock.
- thin-section view of quartzite This microscopic, thin-section view of quartzite shows the tight packing and recrystallization of quartz grains characteristic of quartzite.
- gneiss beautiful handsample of gneiss from the San Gabriel Mountains. The light bands are primarily composed of quartz, and the dark bands are composed of amphibole, so this is a quartz-amphibole gneiss. Enlarge the image to see the porphyroblast in the top right corner of the handsample.
- Gneiss exposed in a roadcut Gneiss exposed in a roadcut near Anza Borrego State Park, southern California
- muscovite mica schist This is a photograph of muscovite mica schist (large specimen in the middle) and two pieces of phyllite (laid atop the schist) taken in the San Gabriel Mountains. Note the larger crystal sizes of the schist, and the higher reflectivity of the phyllite samples. The camera lens is two inches in diameter.
- Muscovite-mica schist Muscovite-mica schist at an outcrop in the San Gabriel Mountains of southern California.
- microscopic, thin-section view of phyllite is a microscopic, thin-section view of phyllite. Enlarge the image to see the more-distinct and wavier foliation of phyllite as compared to slate.
- microscopic, thin-section view of slate This is a microscopic, thin-section view of slate. Enlarge the image to see the faint foliation and tiny mineral crystals characteristic of slate.
- slate quarry A slate quarry in Pennsylvania. Note the person in the red jacket at the bottom of the image for scale.
- Slate littering the slope Slate littering the slope of Titus Canyon, Death Valley.
- shale outcrop A closer look at a shale outcrop.
- ancient dunes A cut away view of ancient dunes clearly show the large-scale cross bedding that is typical of sand dunes. This photograph was taken in Walnut Canyon, Arizona.
- Delicate Arch Delicate Arch, at Arches National Park in Utah, is composed of sandstone.
- Stalactites and stalagmites Stalactites and stalagmites, and two columns.
- Large stalagmites Large stalagmites.
- Ancient ripples on rock slab next to ski pole asymmetrical ripples - both with current direction toward the right
- New ripples with footprints asymmetrical ripples - both with current direction toward the right
- Sand used on Baseball Field Raked sand
- Rock Outcrop Nice layered sedimentary rock outcrop from NY
- Rock Outcrop Nice layered sedimentary rock outcrop from NY
- Rock Outcrop Nice layered sedimentary rock outcrop from NY
- Stratigraphy Taughannock falls stratigraphy
- Stratigraphy Taughannock falls stratigraphy
- Stratigraphy Taughannock falls stratigraphy
- Grand Canyon Aerial shot of the Grand Canyon.
- Grand Canyon Aerial shot of the Grand Canyon.
- Grand Canyon Aerial shot of the Grand Canyon.
- Grand Canyon Aerial shot of the Grand Canyon.
- Grand Canyon Aerial view of the Grand Canyon. Notice the great layers!
- sedimentary rock sedimentary rock
- names and ages of different bedrock formations shows the names and ages of different bedrock formations in North America. The bedrock ages are shown in billions of years.
- three stages of mineral crystal formation shows magnified views of three stages of mineral crystal formation as molten material gradually cools.
- physical tests performed on a mineral. shows the results of three different physical tests, A, B, and C, that were performed on a mineral.
- Rock Formation shows three stages in the formation of a specific rock
- sediment samples represent three sediment samples labeled X, Y, and Z.
- Atmospheric Cross Section Of A Winter Storm System This cross section shows how solid and liquid forms of precipitation depend on the air temperature above Earth’s surface.
- Amount Of Water Vapor That Will Saturate 1 Cubic Meter Of Air Shows the amount of water vapor, in grams per cubic meter, that will saturate 1 cubic meter of air at different temperatures.
- Changes In Relative Humidity And Air Temperature Changes in relative humidity and air temperature during a spring day in Washington, D.C.
- Hurricane Satellite image which shows a Northern Hemisphere hurricane
- Cold Front Moving Cross section below, which shows a typical cold front moving over New York State in early summer.
- General Movement Of Air The cross section shows the general movement of air within a portion of Earth’s atmosphere located between 30° N and 30° S latitude. Numbers 1 and 2 represent different locations in the atmosphere.
- Air Movement In Earth’s Atmosphere Different patterns of air movement in Earth’s atmosphere. Air temperatures at Earth’s surface are indicated in each cross section.
- Average Number Thunderstorms Shows the average number of days each year that thunderstorms occur at different latitudes on Earth.
- Changes In The Atmosphere Occurring Above Typical Air-mass Source Regions Shows changes in the atmosphere occurring above typical air-mass source regions A, B, C, and D. Changes in air temperature and altitude are shown as the graphed lines.
- Cold Front And Warm Front Direction of movement of the cold front and warm front associated with the low-pressure system
- Hurricane Data Recorded information for a major Atlantic hurricane.
- Low Pressure System Shows the position of a low pressure system. The L is the center of the low. The shaded portion represents an area of precipitation. A weather station model for Albany, New York, is shown on the map.
- Low Pressure System Wind Direction of surface winds associated with this low-pressure system
- Low Pressure System The map shows a low-pressure system and some atmospheric conditions at weather stations A, B, and C.
- Sea-level Air Pressure Shows sea-level air pressure, in millibars, for a portion of the eastern coast of North America
- Satellite Image Of Weather Cloud patterns associated with weather fronts over the United States on a certain day. The states of Nebraska (NE) and New York (NY) have been labeled.
- Low-pressure Center Pattern of isobar values, in millibars, and the pattern of wind flow, shown by arrows, at Earth’s surface surrounding a Northern Hemisphere low-pressure center
- Low Pressure Shows the movement of surface air around a low-pressure system in the Northern Hemisphere
- Land Sea Breeze Adjacent land and ocean surfaces have he same temperature at sunrise on a clear, calm, summer day. Then the land and water are heated by the Sun for several hours.
- Six Weather Conditions Shown Six weather conditions shown
- Weather Balloon Data The table shows air temperatures and air pressures recorded by a weather balloon rising over Buffalo, New York.
- Station Model Shows the weather conditions at Rochester, New York, at 4 p.m. on a particular day in June
- Station Model The atmospheric conditions at a given location are represented by the weather station model
- Surface Movement Of Winds Surface movement of winds between 30° N and 30° S latitude
- Weather Map Shows air temperature and winds for a few locations in the eastern half of the United States. A large low-pressure system is shown on the map.
- Station Model Various weather conditions at LaGuardia Airport in New York City are shown on the station model
- Surface Winds Surface winds associated with the high- and low-pressure systems
- Weather Conditions Represent some of the weather conditions at a New York State location on a winter morning.
- Thunderstorm Cloud And Probability Of Hail The data table shows the altitude of the top of a thunderstorm cloud and the probability of hail being formed for a location in New York State. The map shows the average number of days per year hail strikes the ground in different regions of the United States
- Atmospheric Gas Composition Shows the gases that make up the atmosphere and their relative masses in a given volume of air.
- Tornadoes Hit the Bread Basket Tornadoes Hit the Bread Basket
- Tornadoes Hit the Bread Basket Tornadoes Hit the Bread Basket
- Tornadoes Hit the Bread Basket Tornadoes Hit the Bread Basket
- air masses Air masses and their direction of movement across the US
- Lighting while driving Shot showing lighting while driving on a highway at 65 mph
- Hurricane Irene Enhanced Satellite Map United States Enhanced Satellite of Hurricane Irene taken August 27th 2011 at 20:00 hours. Hurricane Irene of 2011 was an Atlantic hurricane that left extensive flood and wind damage along its path through the Caribbean, the United States East Coast and as far north as Atlantic Canada.
- Before Hurricane Irene Beach Flooded Hurricane Irene surge a few hours before she hit. As you can see the beach already flooded during high tide. Photo taken during low tide.
- Hurricane Irene Weather Radar United States Weather Radar Satellite of Hurricane Irene taken August 27th 2011 at 20:00 hours. Hurricane Irene of 2011 was an Atlantic hurricane that left extensive flood and wind damage along its path through the Caribbean, the United States East Coast and as far north as Atlantic Canada.
- Before Hurricane Irene Waves at Jones Beach This is what the waves looked like at Jones Beach NY 5 hours before the storm was set to hit.
- Before Hurricane Irene Waves at Jones Beach This is what the waves looked like at Jones Beach NY 5 hours before the storm was set to hit.
- Hurricane Irene Streets Flooded Here is picture from Long Island NY 12 hours after the last drop of rain from Hurricane Irene fell. As you can see the streets are flooded pretty bad.
- Station Model dewpoint and wind direction shown on the station model
- dry-bulb and wet-bulb temperature The diagram shows dry-bulb and wet-bulb temperature readings for a parcel of air.
- isotherm map weather map shows the air temperatures recorded at the same time at cities across the United States.
- Air Temperature and Dewpoint at Syracuse, New York The weather graphs, which show data recorded at Syracuse, New York, as a winter storm moved across the region between December 1 and December 4, 2007.
- Barometric Pressure at Syracuse, New York The weather graphs, which show data recorded at Syracuse, New York, as a winter storm moved across the region between December 1 and December 4, 2007.
- low-pressure system shows the general surface wind pattern in a low-pressure system located over the eastern United States
- percentage of elements in troposphere percentage of elements by volume in Earth’s troposphere
- Air Temperature vs. Air Pressure Data from two weather instruments have been recorded on the graph below. Line A on the graph represents air-temperature data. Line B was plotted using the scale for variable B.
- Dew Point / Relative Humidity shows the temperature readings on a weather instrument
- convection in the atmosphere The diagram shows a laboratory box used to demonstrate the process of convection in the atmosphere.
- Isotherm Map The maps show the average monthly air temperatures (ºF) over a portion of Earth’s surface for January and July.
- Contour Map Contour map
- Field Map Shows air temperature measurements, in degrees Celsius, taken at the same elevation within a closed room. Two reference points, A and B, are shown.
- Field Map Field map below represents surface air temperatures within a park.
- Air-pressure Field Map Represents a high-pressure system over the central United States. Isobars show the air pressure, in millibars.
- Taterskill Creek The map shows a portion of the Taterskill Creek flowing past the towns of Lawson and Glenton. The shaded area is Taterskill Creek. The arrows in the creek show its direction of flow. Points A, B, and C are locations on the map.
- Length Of Growing Season (in Days) The map shows the length of the growing season in New York State, expressed in days. The growing season is the average number of days between the last frost in spring and the first frost in fall.
- Latitude Longitude Grid The map shows the latitude and longitude grid
- Latitude System Earth’s latitude system
- Time Zone Map United States time zone map shown below. The dashed lines represent meridians (lines of longitude).
- Topographic Map Topographic map
- World Map World map
- Topographic Map The topographic map below shows a particular landscape
- Topographic Map The small map identifies the New York State region shown in the topographic map.
- Topographic Map Topographic map
- Total Inches Of Snowfall Received The three maps represent three different winter seasons. The isolines show the total inches of snowfall received each winter season.
- Topographic Map A grid system of numbers and letters appears along the edge of each map to help locate features. Both maps show elevations in feet above sea level.
- Topographic map Topographic map
- Topographic map Topographic map
- Topographic Map Letters A, B, C, and D represent locations on Earth’s surface. The symbol marks the highest elevation on Patty Hill. Elevations are shown in feet.
- Topographic map The topographic map shows a stream crossing several contour lines and passing through points X and Y. Elevations are measured in feet.
- contour map contour map shows elevations recorded in meters. Line AB is a reference line on the map.
- topographic map shows the location of a stream. Points A and B are locations on Earth’s surface.
- Depth Of Finger Lakes Region Of New York State Depth of Finger Lakes Region of New York State
- Drainage Basin Of The Mississippi River System Several rivers that flow into the Mississippi River are labeled. The arrow at location X shows where the Mississippi River enters the Gulf of Mexico.
- Deeply Eroded Dome Deeply eroded dome
- Eroded Plateau Shows an eroded plateau found in the southwestern United States.
- Development Of A River Delta Show gradual stages 1, 2, and 3 in the development of a river delta where a river enters an ocean.
- Large Valley Shows a mountainous region cut by a large valley in its center.
- Meandering Stream Shows a meandering stream as it enters a lake
- Meandering Stream Shows a meandering stream flowing across nearly flat topography and over loose sediments.
- Landscape Region Over A Period Of Geologic Time Sequence of bedrock cross sections below represents the same landscape region over a period of geologic time.
- Major Streams In The New York State Area Major streams in the New York State area.
- River Delta Satellite photograph below shows a geologic feature composed of silt, sand, and clay.
- Path Of A River Shows the path of a river. The arrow shows the direction the river is flowing. Letters A and B identify the banks of the river.
- River Delta River emptying into an ocean, producing a delta.
- Meandering Stream Meandering stream
- Meandering Stream Shows a meandering stream. Letters A, B, C, and D indicate locations on the streambed.
- Sand Dunes The cross section represents a part of Texas where weakly cemented sandstone is exposed at the surface. The mineral cement holding the sandstone grains together is calcite.
- Watershed Regions Shows watershed regions of New York State
- Rock Structure Rock structure of a deeply eroded, domed mountain region.
- Stream Drainage Patterns Stream drainage patterns for a region of Earth’s surface.
- Sandstone at Medford Beach, NS, Canada This is showing the erosion that occurs on the tidal flats of the Minas Basin along Blomidon and Canning areas. The rock is red Triassic sandstone, which has given up some interesting dinosaur bones.
- Taughannock Falls is located in Ulysses, NY Ppart of the popular Finger Lakes Region of central New York. The falls is part of Taughannock State Park located between the Village of Trumansburg (part of the Ulysses Township), and the city of Ithaca. The falls cataract has an incredible drop of 215 feet (66 meters), and is one of the highest east of the Rocky Mountains.
- Taughannock Falls is located in Ulysses, NY Part of the popular Finger Lakes Region of central New York. The falls is part of Taughannock State Park located between the Village of Trumansburg (part of the Ulysses Township), and the city of Ithaca. The falls cataract has an incredible drop of 215 feet (66 meters), and is one of the highest east of the Rocky Mountains.
- mesas view from south mesas view from south
- new river mesa wide new river mesa wide
- Seasonal Stream Seasonal Stream
- Beautiful Ocean Landscape View Beautiful Ocean Landscape View
- Waterfall This is a waterfall flowing in the fall of 2006.
- Waterfall Zoomed Out This is a waterfall flowing in the fall of 2006.
- Taughannock Falls Information Poster Hard to see, but this is the background information for the falls that greets visitors on the overlook.
- Taughannock Falls Map Hard to see, but this is the map of the falls that greets visitors on the overlook.
- Taughannock Falls Overlook This is a shot of the falls during an October visit. This was taken from the scenic overlook.
- Taughannock Falls Zoomed In This is a zoomed shot of the falls during an October visit. This was taken from the scenic overlook.
- Taughannock Falls This is a shot of the falls during an October visit. This was taken from the scenic overlook.
- Bridge Concrete and rock bridge set over a local river during the summer
- Water Fall Warning Sign warning vistors of the danagers assoicated with the falls
- Log In River Great shot to show the powerful force of water. River is very low and currently unable to move the log.
- Waterfall Summertime waterfall shot
- Waterfall Summertime waterfall shot with nice foliage in background
- Grand Canyon of Yellowstone
- Waves Crashing Waves crashing on a rock jutting into the ocean
- Palm Trees Some palm trees on the beach
- No Trespassing A No Trespassing sign nailed to a tree in the middle of the woods
- Sun through trees Cool shot of the sun peering through the trees in a forest in Canada
- Sunset Great sunset over a field in Canada
- Sunset Great sunset over a field in Canada
- Australia’s major landscape regions two maps of Australia below. Map I shows Australia’s major landscape regions. Letters A through H represent locations in Australia. Map II shows Australia’s general climate regions.
- Generalized Bedrock Map shows the generalized bedrock of a part of western New York State.
- generalized cross section The generalized cross section shows the sedimentary rock layers at Niagara Falls in western New York State.
- Yearly precipitation in New York State The map shows the average yearly precipitation in New York State measured in inches.
- stream drainage patterns The maps labeled A, B, and C show three different stream drainage patterns.
- Grand Canyon The block diagram represents a portion of the Grand Canyon.
- watershed regions in New York State The map shows four watershed regions in New York State labeled A through D.
- Earthquakes Along The Crustal Plate Boundary Shows the depths of selected earthquakes along the crustal plate boundary near the west coast of South America. Letters A, B, C, and D are epicenter locations along a west-to-east line at the surface. The relative depth of each earthquake is indicated.
- Geologic Block Diagram Shows surface features and subsurface structures of a section of Montana
- Epicenter Of An Earthquake The map shows the location of the epicenter, X , of an earthquake that occurred on April 20, 2002, about 29 kilometers southwest of Plattsburgh, New York.
- Age Of Rocks On The Sea Bottom Relative To Ridges Shows the location of mid-ocean ridges and the age of some oceanic bedrock near these ridges.
- Earthquake Seismogram Earthquake seismogram
- Lateral Fault (shearing) Lateral Fault (shearing)
- Deformed Rock Structure Deformed rock structure found on Earth’s surface.
- Crustal Movement Cross section below shows rock layers that underwent crustal movement during an igneous intrusion in the Cretaceous Period.
- Fault In The Sedimentary Rocks Escarpment (cliff) located in the western United States. The directions for north and south are indicated by arrows. A fault in the sedimentary rocks is shown on the front of the escarpment.
- Models Of Earthquake Waves Models of two types of earthquake waves
- Location Of Volcanoes Shows the location of volcanoes in Colombia, South America.
- Mantle Convection Mantle convection currents are most likely moving beneath colliding lithospheric plates
- Rift Valley In The Center Of A Mid-ocean Ridge Shows details of a section of a rift valley in the center of a mid-ocean ridge. The vertical lines in the diagram represent faults and fractures within the ocean floor bedrock.
- Reverse Fault (compression) Reverse Fault (compression)
- Oceanic Ridge At A Divergent Plate Boundary Oceanic Ridge at a Divergent Plate Boundary
- Ocean Ridge And Transform Faults The continents of Africa and South America, the ocean between them, and the ocean ridge and transform faults.
- Normal Fault (tension) Normal Fault (tension)
- Plate Boundary Diagram below shows the interaction of two tectonic plates.
- Seismic Waves Seismic waves traveling from the focus of an earthquake
- Washington And Oregon Earthquakes The plate boundary shown on the map is the source area for high-magnitude earthquakes in Washington and Oregon. Two hazardous zones associated with these earthquakes are also shown.
- Tectonic Plates And The Boundaries Between Them The map shows some tectonic plates and the boundaries between them. Letters A and B are locations on Earth’s surface. The data table shows the depth below Earth’s surface of five earthquakes measured from location A toward location B.
- Volcanic Peaks In The Cascade Mountain Range The map shows the name and location of the volcanic peaks in the Cascade Mountain Range of the northwestern United States west of the Yellowstone Hot Spot. The table shows the major eruptions of each peak over the past 4,000 years.
- Thrust Fault Thrust Fault
- Volcano Large cone-shaped mountain on Earth’s surface is a volcano
- Seismogram Shows P-wave and S-wave arrival times at a seismic station following an earthquake.
- Three Seismograms Three seismograms showing the same earthquake as it was recorded at three different seismic stations, A, B, and C.
- Tectonic Plates Line AB is drawn across several of Earth’s tectonic plates in the South Atlantic Ocean.
- Seismogram Seismogram below shows the time that an earthquake P-wave arrived at a seismic station in Albany, New York.
- Seismogram Tracings Shows two seismogram tracings, at stations A and B, for the same earthquake. The arrival times of the P-waves and S-waves are indicated on each tracing.
- Rock outcrop with faulting Rock outcrop with faulting
- seismogram Active seismogram
- seismogram Active seismogram
- Old Lava flow into the ocean Shot shows the cooled lava which flowed into the ocean creating new land along the coast.
- Glowing lava with moon above Cool shot from volcano national park with the moon directly above the lava in the evening.
- Cross section of Earth The cross section of Earth below shows a P-wave moving away from an earthquake epicenter to seismic station A.
- Earthquake Intensity with Modified Mercalli Scale Earthquake Intensity with Modified Mercalli Scale
- Modified Mercalli Intensity Scale Modified Mercalli Intensity Scale
- tectonic plate boundaries Shows the tectonic plate boundaries near the East African Rift. Arrows show relative tectonic plate movement.
- Zones of Earth’s interior represents zones of Earth’s interior, identified by letters A through E. The scale shows depths below Earth’s surface, measured in kilometers.
- block diagram shows a cross section of a landscape. Letters A, B, C, D, and E represent different rock layers
- block diagram block diagram below shows the boundary between two tectonic plates.
- seismic stations which gives information collected at seismic stations W, X, Y, and Z for the same earthquake. Some of the data have been omitted.
- lithospheric plates shows the boundary between two lithospheric plates. Point X is a location in the continental lithosphere. The depth below Earth’s surface is labeled in kilometers.
- seismograms shows four seismograms labeled I, II, III, and IV, which were recorded at seismic stations A, B, C, and D during the same time interval.
- seismogram The seismogram was recorded at a seismic station and shows the arrival times of the first P-wave and S-wave from an earthquake.
- modified Mercalli intensity scale damage zones The map shows modified Mercalli intensity scale damage zones resulting from a large earthquake that occurred in 1964. The earthquake’s epicenter was near Anchorage, Alaska. The cities Kodiak and Anchorage are shown on the map.
- Cross Section Shows several rock formations found in New York State. The rock layers have not been overturned.
- Bedrock Cross Section The cross section represents part of Earth’s crust where natural gas, oil, and water have moved upward through a layer of folded sandstone and filled the pore spaces at the top of the sandstone layer.
- Cross Section Show widely separated outcrops at locations W, X, Y, and Z. The rock layers have not been overturned. Line AB in the cross section at location W represents an unconformity. Fossils are shown in some of the layers.
- Cross Section The top layer of soil contains broken rock fragments. A representative sample of this layer has been magnified.
- Bedrock Layers Represents bedrock layers found in an outcrop. Three index fossils are found within the bedrock layers.
- Cross Section A through G identify rock layers and Q represents a fault. Lines W, X, Y, and Z are locations of unconformities. The rocks have not been overturned.
- Changes In The Distribution Of Land And Water Show changes in the distribution of land and water in the Mediterranean Sea region that scientists believe took place over a period of 6 million years.
- Cross Section The cross section represents the bedrock structure beneath four landscape regions, A, B, C, and D.
- Bedrock Outcrops Bedrock outcrops A and B are located at two different locations along the Genesee River in western New York State. Rock layers 1, 2, and 4 are the same in both outcrops.
- Centroceras Shows a fossil found in the surface bedrock of New York State.
- Cross Section The cross section shows a portion of Earth’s crust. The age, in millions of years, of each boundary between the different sedimentary rock layers is shown. The age of boundary X between the sedimentary rock and the metamorphic rock is not shown.
- Cross Section Of New York State Bedrock Cross section of New York State bedrock that has not been overturned. Line X represents an unconformity.
- Cross Section Of The Bedrock Outcrop Cross section of the bedrock outcrop shown below and on your knowledge of Earth science. Index fossils found in some of the rock units are shown. The rock units are labeled I through IX.
- Cross Section Cross section of Earth’s crust.
- Geologic Cross Section Geologic cross section below shows the geologic age of two rock layers separated by an unconformity.
- Cross Section Shows a V-shaped valley and the bedrock beneath the valley.
- Geologic Changes The gradual geologic changes in layer X, located just below Earth’s surface.
- Geologic Ages Of Wellknown Fossils Geologic ages of some wellknown fossils
- Cross Section Geologic cross section of a portion of Earth’s crust
- Geologic Cross Section Geologic cross section. Letters A through D represent different rock units.
- Radioactive Decay Model Represents a model of the radioactive decay of a particular element. The diagram shows the decay of a radioactive element ( )into the stable decay element ( )after one half-life period.
- Outcrop Of Horizontal Rock Shows an outcrop of horizontal rock layers in New York State
- Geologic Cross Section Geologic cross section
- Iridium Abundance In A Rock Core Sample The data table shows the abundance of iridium, in parts per billion (ppb), found in a rock core sample taken in Carlsbad, New Mexico.
- Half Life Chart Percent of U-235, Remaining Percent Decayed to Pb-207, Half-Lives Elapsed
- Geologic Cross Sections Represent different stages in the development of one part of Earth’s crust over a long period of geologic time.
- Geologic Cross Section Shows a hillslope and the rock layers that underlie it.
- Geologic Drill Core Geologic drill core below shows bedrock layers A, B, and C that have not been overturned. The geological ages of layers A and C are shown.
- Materials Escaping From Early Earth Shows four different chemical materials escaping from the interior of early Earth.
- Geologic Cross Section The cross section shows the surface of a landscape region in the southwestern United States and indicates the age, type, and thickness of the bedrock.
- Trilobite Fossil The map of Canada shows the fossil site. The scale drawing shows the new trilobite fossil compared to other trilobite fossils.
- Table Of Index Fossils Table of Index Fossils
- Radioactive Decay Of Carbon-14 Part of the table has been deliberately left blank for student use.
- Climate Regions Of New York State The map shows five climate regions of New York State. The bar graphs show average monthly temperatures of four of these climate regions.
- Mud Cracks These are mud cracks left in shales that were formed along the edges of an ancient lake bed. They indicate periods of dry climate.
- Cross section The cross section shows the general bedrock structure of an area containing three different landscape regions, A, B, and C.
- cross section cross section
- block diagram block diagram below, which shows rock units that have not been overturned
- Cross Section Letters A through H represent rock units in which overturning has not occurred.
- radioactive decay The table below shows how the radioactive decay of potassium-40 can be used to determine the age of a rock.
- Rock cross section cross section shows a portion of Earth’s crust.
- cross sections surface bedrock The cross sections show the surface bedrock in two different locations 20 miles apart. Rock layers are labeled 1, 2, 3, 4, and X. The rock layers have not been overturned.
- events in the history of Earth shows specific events in the history of Earth from the beginning of the universe to the present.
- Geologic Cross Section Rock layers A through E have been labeled. Two index fossils are shown and their locations within the rock layers are indicated.
- geologic cross section The rock layers have not been overturned.
- Cross Section shows the bedrock structure of a portion of the lithosphere. Letters A through D represent locations in the lithosphere.
- Climate Regions Of New York State The map shows five climate regions of New York State. The bar graphs show average monthly temperatures of four of these climate regions.
- Air Moving Off The Ocean And Over A Mountain Shows warm, moist air moving off the ocean and over a mountain, causing precipitation between points 1 and 2.
- Inferred Changes In Earth’s Average Temperature The graph shows inferred changes in Earth’s average temperatures over the last 500 million years.
- Amount Of Sea Ice Show the amount of sea ice surrounding the continent of Antarctica at two different times of the year.
- Prevailing Wind The map shows an imaginary continent on Earth. Arrows represent prevailing wind directions.
- El Nino Represent the Pacific Ocean and the atmosphere near the Equator during normal weather (cross section A) and during El Niño conditions (cross section B). Sea surface temperatures (SST) are labeled and trade-wind directions are shown with arrows.
- Wind And Moisture Belts Planetary wind and moisture belts in Earth’s Northern Hemisphere.
- Water Cycle Flowchart below shows part of Earth’s water cycle. The question marks indicate a part of the flowchart that has been deliberately left blank.
- Hydrologic Cycle Water cycle diagram
- Windward And Leeward Sides Shows the prevailing winds that cause different climates on the windward and leeward sides of this mountain range.
- Winds Over A Mountain Cross section below shows the flow of winds over a mountain ridge.
- Greenhouse Greenhouse
- Monsoon Winds Arrows on the two maps below show how the monsoon winds over India change direction with the seasons.
- Different sediments Shows columns A, B, C, and D that contain different sediments
- air over a mountain Shows the flow of air over a mountain, from location A to B to C.
- Greenland Ice Melt The map shows the extent of summer ice-melt zones on Greenland in 1992 and 2002. The summer melt zone is an area where summer heat turns snow and ice around the edges of the ice sheet into slush and ponds of meltwater. Three coastal locations are shown on the map.
- Water Cycle The arrows represent some water cycle processes. Letter A indicates a surface location on Earth.
- Earth from above the North Pole The map shows a view of Earth from above the North Pole. Points on the map indicate the positions of Reykjavik, Iceland, and Yakutsk, Russia. The graphs show average monthly air temperature (line graphs) and amount of precipitation (bar graphs) for both locations.
- water retention and permeability Shows an experimental setup to compare water retention and permeability in two columns with equal volumes of spherical plastic beads of different diameters.
- Average yearly rainfall The map shows isolines of average yearly rainfall, in centimeters, for the Congo River region of Africa.
- buried in silt The photograph shows farm buildings partially buried in silt.
- spherical beads of different diameters The diagram below shows three identical plastic tubes filled to the same level with spherical beads of different diameters. Each tube was filled with water to the top of the beads. The clamps were then opened to allow water to drain into the beakers.
- greenhouse effect represents the greenhouse effect in which heat energy is trapped in Earth’s atmosphere.
- El Niño conditions The maps show differences in trade wind strength, ocean current direction, and water temperature associated with air-pressure changes from normal climate conditions to El Niño conditions.
- tubes containing sediment shows four tubes containing 500 milliliters of sediment labeled A, B, C, and D. Each tube contains well-sorted, loosely packed particles of uniform shape and size and is open at the top. The classification of the sediment in each tube is labeled.
- Altitude Of The Sun At Solar Noon Shows the altitude of the Sun at solar noon on certain dates. The positions of the Sun, labeled A, B, and C, were measured by an observer at 42° north latitude.
- Apparent Diameter Of The Sun During The Year Lists the apparent diameter of the Sun, measured in minutes and seconds of a degree, as it appears to an observer in New York State. (Apparent diameter is how large an object appears to an observer.)
- Apparent Path Of The Sun Shows the apparent path of the Sun as viewed by an observer at a certain Earth location on March 21
- Angle Of The Sun’s Noontime Rays Shows the angle of the Sun’s noontime rays received at different Earth latitudes on May 1
- Celestial Sphere Represents a model of the sky (celestial sphere) for an observer in New York State. The curved arrow represents the Sun’s apparent path for part of one day. The altitude of Polaris is also indicated.
- Altitude And Apparent Position Of The Noontime Sun Shows the altitude and apparent position of the noontime Sun, as seen from various latitudes on Earth on a particular day of the year.
- Calendar Model Of The Inferred History Of The Universe The 12-month time line begins with the Big Bang on January 1 and continues to the present time, which is represented by midnight on December 31. Several inferred events and the relative times of their occurrence have been placed in the appropriate locations.
- Apparent Path And Position Of The Sun Shows a model of the apparent path and position of the Sun in relation to an observer at four different locations, A, B, C, and D, on Earth’s surface on the dates indicated.
- Angle Of Insolation Relationship between the angle of insolation and the intensity of insolation
- Altitude Of Polaris Shows an observer on Earth measuring the altitude of Polaris.
- Constellations Constellations in the night sky viewed by a group of students.
- Ellipse Ellipse
- Earth Revolving Around The Sun Represents an exaggerated view of Earth revolving around the Sun.
- Duration Of Insolation Duration of insolation at different latitudes for three different days during the year
- Earth's Orbit Around The Sun Earth at four different positions, A, B, C, and D, in its orbit around the Sun.
- Earth’s Rotation Represents the direction of Earth’s rotation as it appears from above the North Pole. Point X is a location on Earth’s surface.
- Ellipse Constructed ellipse. F1 and F2 are the foci of the ellipse
- Eclipse Relative positions of the Sun, the Moon, and Earth when an eclipse was observed from Earth
- Earth's Orbit As Viewed From Space Earth at a specific position in its orbit as viewed from space. The shaded area represents nighttime.
- Moon And Earth Show the Moon and Earth as viewed from space.
- Location Of The Seven Brightest Stars In Orion Lists the seven brightest stars, numbered 1 through 7, in the constellation Orion. This constellation can be seen in the winter sky by an observer in New York State. The table shows the celestial coordinates for the seven numbered stars of Orion.
- Flashhlight Globe Demo Two identical flashlights were placed in the positions shown and they illuminated areas of varying size, A and B, on a classroom globe. Thermometers were then placed at the center of each illuminated area to measure the rate of temperature increase.
- Moon In Its Orbit Moon in its orbit, as viewed from above Earth’s North Pole.
- Foucault Pendulum Foucault pendulum swinging freely for 8 hours.
- Moon And The Sun At Sunset Positions of the Moon and the Sun at sunset during an evening in New York State.
- Moon Revolution Shows the Moon at four positions in its orbit around Earth.
- Force Of Gravity Between Earth And The Sun Force of gravity between Earth and the Sun during one revolution of Earth around the Sun
- Elliptical Orbit Elliptical orbit of a moon revolving around a planet
- Milky Way Galaxy Represents the shape of the Milky Way Galaxy.
- Orbit Of Planet D Around A Star Shows the orbit of planet D around the star Upsilon Andromedae. The dashed lines show where the paths of the first four planets of our solar system would be located if they were going around Upsilon Andromedae instead of the Sun.
- Shadow Of A Vertical Stick Represent the length and direction of the shadow of a vertical stick measured at noon on three different dates at 42° N latitude.
- Path Of The Sun During The Year At The Equator Apparent path of the Sun observed at various times during the year at the Equator
- Ocean Tides The water levels of ocean tides measured in Boston, Massachusetts, for a 2-day period.
- Moon’s Orbit Around Earth Four positions of the Moon are represented by letters A, B, C, and D. Earth’s North Pole is labeled. The shaded areas on Earth and the Moon represent night.
- Shadow The diagram shows a pin perpendicular to a card. The card was placed outdoors in the sunlight on a horizontal surface. The positions of the pin’s shadow on the card were recorded several times on March 21 by an observer in New York State.
- Shadow Cast By A Telephone Pole Shows the shadow cast by a telephone pole on March 21 at solar noon at a location in New York State.
- Noontime Shadow Shows the noontime shadow cast by a vertical post located in New York State.
- Satellite Revolution Shows a satellite in four different positions as it revolves around a planet.
- Polaris Polaris’ altitude is equal to a location’s latitude.
- Sun’s Apparent Daily Path Numbered positions of the Sun at four different times along the Sun’s apparent daily path, as seen by an observer in New York State. Numbers 1 through 4 represent apparent positions of the Sun.
- Solar Sunspots And Magnetic Activity Shows changes in the Sun’s magnetic activity and changes in the number of sunspots over a period of approximately 100 years. Sunspots are dark, cooler areas within the Sun’s photosphere that can be seen from Earth.
- Sunlight Entering A Room Shows sunlight entering a room through the same window at three different times on the same winter day.
- The Life Cycles Of Stars Shows two possible sequences in the life cycle of stars, beginning with their formation from nebular gas clouds in space.
- Shadows Cast Noontime shadows cast by a student and a tree.
- Stages In An Eclipse Of The Sun Stages in an eclipse of the Sun
- Star Spectrum Standard spectrum compared to a spectrum produced from a distant star.
- Solar Eclipse Positions of Earth (E), the Sun, and the Moon (M) that created the solar eclipse
- Solar Eclipse May 20, 1947 Shows regions of Earth where a solar eclipse was visible on May 20, 1947.
- Tidal Changes The graph shows the recorded change in water level (ocean tides) at a coastal city in the northeastern United States during 1 day.
- Time Exposure Photograph A camera was placed outside at night and pointed directly at Polaris and several other stars. The lens was kept open and a time-exposure photograph was taken.
- Electromagnetic Energy Given Off By The Sun Shows the types of electromagnetic energy given off by the Sun. The shaded part of the diagram shows the approximate amount of each type actually reaching Earth’s surface.
- Lunar Eclipse Lunar Eclipse
- Lunar Eclipse Lunar Eclipse
- Halley's Comet Taken March 8, 1986
- Solar Prominence Erupts Pictured is a solar prominence that erupted on May 15 2001, throwing electrons and ions out into the Solar System
- 5th - Astronomical Sizing to Scale? These images were sent to me in an e-mail. They were ordered from the smallest (1st) to the largest (5th) and seem to do a good job relying the concept of scale in the solar system.
- 4th - Astronomical Sizing to Scale? These images were sent to me in an e-mail. They were ordered from the smallest (1st) to the largest (5th) and seem to do a good job relying the concept of scale in the solar system.
- 3rd - Astronomical Sizing to Scale? These images were sent to me in an e-mail. They were ordered from the smallest (1st) to the largest (5th) and seem to do a good job relying the concept of scale in the solar system.
- 2nd - Astronomical Sizing to Scale? These images were sent to me in an e-mail. They were ordered from the smallest (1st) to the largest (5th) and seem to do a good job relying the concept of scale in the solar system.
- 1st - Astronomical Sizing to Scale? These images were sent to me in an e-mail. They were ordered from the smallest (1st) to the largest (5th) and seem to do a good job relying the concept of scale in the solar system.
- Able and Baker Nose Cone Monkeys "Able" and "Baker" became the first monkeys to survive spaceflight after their 1959 flight.
- Apollo 16 Crew Door Hatch door from the Appollo 16 capsule.
- Apollo 16 Heat Shield The charred remains of the re-entered Apollo 16 heat shield.
- Apollo 16 Capsule Apollo 16 was the tenth manned mission in the Apollo program, the fifth mission to land on the Moon and the first to land in a highlands area. The mission was launched on April 16, 1972, and concluded on April 27. It was a J-class mission, featuring a Lunar Rover and it brought back 94.7 kg of lunar samples.
- Ares V Rockets Scale models of the Ares V rockets. The Ares V is being designed as a heavy-launch vehicle to send large hardware and materials to the Moon or send supplies beyond Earth orbit to sustain human presence there.
- Ham the Chimp Capsule Ham (July 1956 – January 19, 1983), also known as Ham the Chimp and Ham the Astrochimp, was the first hominid launched into outer space. Ham's name is an acronym for the lab that prepared him for his historic mission — the Holloman Aerospace Medical Center, located at Holloman Air Force Base in New Mexico.
- Early Astronaut Suit Here is a shot of an older astronaut suit
- German V-1 Rocket The V-1 was designed by Robert Lusser of the Fieseler company and Fritz Gosslau from the Argus engine works, with a fuselage constructed mainly of welded sheet steel and wings built similarly or of plywood. The simple pulse jet engine pulsed 50 times per second.
- Lunar rover The Lunar Roving Vehicle (LRV) or lunar rover (popularly known as the moon buggy) was a 4-wheeled rover used on the Moon during the last three missions (15, 16, and 17) of the Apollo program in the early 1970s.
- NASA mobile lab NASA mobile lab
- NASA centaur g-prime high energy engine NASA centaur g-prime high energy engine
- Mercury Capsule Project Mercury was the first human spaceflight program of the United States. It ran from 1959 through 1963 with the goal of putting a human in orbit around the Earth. The Mercury-Atlas 6 flight on 20 February 1962 was the first Mercury flight to achieve this goal. Early planning and research was carried out by the National Advisory Committee for Aeronautics, and the program was officially conducted by the newly created NASA.
- NASA mobile quarantine facility This Mobile Quarantine Facility (MQF) was one of four built by NASA for astronauts returning from the Moon. Its purpose was to prevent the unlikely spread of lunar contagions by isolating the astronauts from contact with other people. A converted Airstream trailer, the MQF contained living and sleeping quarters, a kitchen, and a bathroom. Quarantine was assured by keeping the air pressure inside lower than the pressure outside and by filtering the air vented from the facility.
- Pathfinder (Space Shuttle) Originally unnamed, the simulator was built at the Marshall Space Flight Center in 1977 for use in activities such as checking roadway clearances, crane capabilities and fits within structures. It was later shipped by barge to the Kennedy Space Center and was used for ground crew testing in the Vehicle Assembly Building, Orbiter Processing Facility, and Shuttle Landing Facility. Pathfinder is approximately the same size, shape and weight of an actual Orbiter.
- Pathfinder (Space Shuttle) Rear View Pathfinder (Space Shuttle)
- orion capsule Orion is a spacecraft design currently under development by the United States space agency NASA. Each Orion spacecraft will carry a crew of four to six astronauts. The spacecraft is designed to be launched by the Ares I, a launch vehicle, also currently under development. Both Orion and Ares I are elements of NASA's Project Constellation, which plans to send human explorers back to the Moon by 2020, and then onward to Mars and other destinations in the Solar System.
- redstone engine The Redstone rocket was an Army bombardment rocket that was developed by the Rocketdyne Division of North American Aviation.
- Rocket Sizes Shows various rockets and their sizes in relation to each other.
- Saturn I The Saturn I was the United States' first dedicated "space launcher," a rocket designed specifically to launch loads into Earth's orbit. Most of the rocket's power came from a "clustered" lower stage consisting of tanks taken from older rocket designs and strapped together to make a single larger booster.
- Saturn I Engine The Saturn I was the United States' first dedicated "space launcher," a rocket designed specifically to launch loads into Earth's orbit. Most of the rocket's power came from a "clustered" lower stage consisting of tanks taken from older rocket designs and strapped together to make a single larger booster.
- F-1 (rocket engine) The F-1 is a rocket engine developed by Rocketdyne and used in the Saturn V. Five F-1 engines were used in the S-IC first stage of each Saturn V, which served as the main launch vehicle in the Apollo program. The F-1 is still the most powerful single-chamber liquid-fueled rocket engine developed
- F-1 (rocket engine) The F-1 is a rocket engine developed by Rocketdyne and used in the Saturn V. Five F-1 engines were used in the S-IC first stage of each Saturn V, which served as the main launch vehicle in the Apollo program. The F-1 is still the most powerful single-chamber liquid-fueled rocket engine developed
- saturn v used by NASA's Apollo and Skylab programs from 1967 until 1973. In total NASA launched thirteen Saturn V rockets with no loss of payload. It remains the largest and most powerful launch vehicle ever brought to operational status from a height, weight and payload standpoint.
- saturn v engine used by NASA's Apollo and Skylab programs from 1967 until 1973. In total NASA launched thirteen Saturn V rockets with no loss of payload. It remains the largest and most powerful launch vehicle ever brought to operational status from a height, weight and payload standpoint.
- skylab fragment Skylab was the United States' first space station, and the second space station visited by a human crew. It was also the only space station NASA launched alone. The 100-ton space station was in Earth's orbit from 1973 to 1979 and it was visited by crews three times in 1973 and 1974.
- space camp habitat This is where campers at space camp live.
- v2 rocket v2 rocket
- various rockets various rockets
- v2 rocket v2 rocket
- Moon over trees Crescent moon over trees on a sunset evening
- movement of water The arrows in the block diagram show the movement of water after it has fallen as precipitation.
- Earth and the Moon in four locations during their orbits Shows Earth and the Moon in four locations during their orbits. Arrows A through D represent different motions of Earth, the Moon, and the Sun.
- Moon Phases Shows positions of the Moon in its orbit and phases of the Moon as viewed from New York State.
- duration of insolation The table shows the duration of insolation, in hours, at Barrow, Alaska, on the twentieth day of each month during 2008.
- High and low tides on Earth Shows the locations of high and low tides on Earth at a particular time.
- Orbital paths of Earth, Mars, and Jupiter The diagram shows the orbital paths of Earth, Mars, Jupiter, and a comet named Wild 2.
- Large pendulum The diagram shows a large pendulum in motion over an 8-hour period.
- Tree Shadow A tree in New York State casts a shadow as shown in the diagram.
- Moon Calender The dates of major Moon phases, as seen in New York State, are shown.
- Star Chart shows the locations of several constellations visible in the night sky
- solar eclipse shows the position of the Sun, the Moon, and Earth during a solar eclipse. The full shadow (umbra) and partial shadow (penumbra) of the Moon and Earth are shown.
- Earth’s orbit around the Sun Earth’s orbit around the Sun as viewed from space. Earth is shown at eight different positions labeled A through H. Earth’s North Pole, Arctic Circle, and equator have been labeled at position C. The arrows show the direction of orbital motion.
- Earth’s orbit and the orbit of a comet which shows Earth’s orbit and the orbit of a comet within our solar system.
- Periods of Planetary Revolution shows the distance from the Sun and the period of revolution for four planets in our solar system labeled A, B, C, and D.
- Moon in its orbit around Earth shows one position of the Moon in its orbit around Earth. Letters W, X, Y, and Z are locations on Earth’s surface.
- Development of our universe The diagram represents the development of our universe from the time of the Big Bang until the present. Letter A indicates two celestial objects.
- constellations The constellation Pisces changes position during a night, as shown in the diagram below.
- life cycle of stars represents possible stages in the life cycle of stars
- Earth revolving around the Sun represents Earth revolving around the Sun. Letters A, B, C, and D represent Earth’s location in its orbit on the first day of the four seasons. NP represents the North Pole.
- north polar view of Earth represents a north polar view of Earth on a specific day of the year. Solar times at selected longitude lines are shown. Letter A represents a location on Earth’s surface.
- heavy mass moving back and forth The diagram shows a heavy mass moving back and forth in a straight-line direction. The apparent direction of movement changes over time.
- Moon at positions in its orbit around Earth The diagram shows the Moon at four positions in its orbit around Earth as viewed from above the North Pole. The date of one of the four positions has been labeled.
- Moon Phases 4 different moon phases
- apparent path and solar noon show the apparent path and solar noon positions of the Sun on specific dates at three different locations on Earth.
- Dinosaur Shows an artist’s view of the dinosaur, based on the fossilized remains.
- Cystiphyllum Cystiphyllum
- Elliptocephala Elliptocephala
- Fossil Snail Fossil Snail
- Phacops Phacops
- Mastodont Mastodont
- Prosauropod This is a picture of a scientist working (for a few minutes) on a skull of a Prosauropod, found at Wasson's Bluff, near Parrsboro, NS. It will take about 2 years to completely release this skull from the rock. The lab is in the Fundy Geological Museum - a working research facility.
- fossilized fish skeletons These fossilized fish skeletons were collected from ancient lakebed deposits in Wyoming. Note the fine details preserved by the replacement of the original skeletal material with hematite.
- fossilized fish skeletons These fossilized fish skeletons were collected from ancient lakebed deposits in Wyoming. Note the fine details preserved by the replacement of the original skeletal material with hematite.
- ammonite and a gastropod ammonite and a gastropod
- ammonites cluster of ammonites whose original aragonite shells have been completely replaced by pyrite
- trilobite trilobite whose exoskeleton has been replaced by a carbon film
- gastropod fossils fossiliferous limestone rich in recrystallized gastropod fossils
- fossilized turtle shell fossilized turtle shell
- fern leaf fossil cast fern leaf fossil cast
- Trilobites trilobites
- Ammonite Lovers Sign
- archaeopteryx berlin specimen
- archaeopteryx london specimen
- Changing View Dinos Series of models showing the progression of dinosaurs views over the years
- Coal This is a sample of what 20 pounds of coal looks like
- Masdont Infamous Cornell Masdont
- Rock Correlation Explained Images showing how rocks are correlated using the principle of superposition
- Crinoids Great sample displaying miltiple crinoid stems and some crinoid flowers
- Crinoid Flowers Nice fossil displaying two crinoid flowers with partial stems
- Dinosaur Imprint Cast of a large dinosaur imprint with a size 11 sneak for comparison
- Unknown Fossil Unknown
- Unknown Fossil Unknown
- Fossil Draws Here is where several thousand fossils are kept at a local muesum
- Fossil Fish Limestone with a small fossil fish
- Horseshoe Crab Fossil Great sample of a medium horse shoe crab
- Fossil Leaf Leaf fossilsed in a limestone matrix
- eurypterid A very large eurypterid fossil
- Mud Cracks Large piece of limestone displaying mud cracks
- apatosaurus New view of apatosaurus
- T-Rex New view of T-Rex
- apatosaurus old view of apatosaurus
- T-Rex Old view of T-Rex
- phylum cnidaria Various fossils from the phylum cnidaria
- phylum poritera Various fossils from phylum poritera
- placodermi armored fish placodermi armored fish model
- placodermi armored fish fossil
- Whale Skull Skeleton of a large whale
- Whale Skeleton Skeleton of a large whale
- Stromatolite Cross sectional view of a small section of a stromatolite
- spikey trilobite not sure of the fossil species, but pretty cool
- Synaspsid Skull Cast of a reptile like synaspsid
- Taughannock Falls Zoomed in view of falls
- Theraspod Skull Cast of a skull from the theraspod reptile
- Theropod A large skull from a theropod
- Trilobite Nice sample of a trilobite
- Trilobite Nice sample of a smaller trilobite
- Very Large Eurypterid Sample measures over 4 feet in size and is an actual fossil
- coral reef distribution and diversity shows coral reef distribution and diversity (number of different coral types) around the world. Isolines on the map represent the number of different types of coral. Coral reefs are found mostly in shallow tropical waters and do not grow when ocean temperatures fall below 18°C.
- Chicxulub Crater The map below shows the location of Chicxulub Crater created 65.5 million years ago by an asteroid impact.
- Equal Volumes Of Four Samples Equal volumes of the four samples
- Drill Rig Drill rig used to collect rock samples from below Earth’s surface.
- Drill Core Drill core of sediment that was taken from the bottom of a lake.
- Oil And Natural Gas Deposits The cross section shows a typical bedrock structure where oil and natural gas deposits are found.
- old fellows home sign Funny sign from the Ithaca home of Odd Fellows
- Gold Mine Town A now defunct gold mine and the town that surrounds it.
- We Don't Rent Pigs A random sign found in a small western US town.
- Drill Core The drill-core samples were taken from two locations 1000 kilometers apart. Rock layers 1 through 8 have been labeled. Some index fossils are shown in the layers.
- block diagram block diagram below shows a part of the eastern coastline of North America. Points A, B, and C are reference points along the coast.
- magnetic polarity preserved by minerals The diagram shows the magnetic polarity preserved by minerals within the bedrock of the oceanic crust near the Mid-Atlantic Ridge. Letters A, B, C, and D represent locations in the ocean-floor bedrock.
- Glacial Striations - Vroman's Nose Middleburg, NY Nice view of striations at the top of a local landmark - Vroman's Nose. Note that there can be clearly seen two sets of striations slightly askew to one another, suggesting at least two episodes of moving ice.
- Vroman's Nose A view across the Schoharie Valley of Vroman's Nose. This landform was carved by Pleistocene glaciation. The outcrops on the front were plucked by ice. There is a hiking trail to the top that will be rewarded with spectacular views of the valley, as well as glacial features and marine fossils.
- Vroman's Nose - Marine Fossils 600 feet above the valley floor, and 1220 feet above sea level are marine fossils from the Devonian sea that once covered this area.
- Vroman's Nose - Ripple Marks Along with marine fossils, ripple marks can be seen at the top of Vroman's Nose.
- Flood Gauge on the Batavia Kill A flood gauge used by the USGS to monitor the flow of a stream in upstate New York.
- Aqueduct This aqueduct once carried the Erie Canal over the Schoharie Creek.
- Hydroelectric Station This hydroelectric station is the Blenheim-Gilboa Power Project, which is a part of the New York Power Authority. Electricity is generated through the force of running water. More about this facility can be found at: http://www.nypa.gov/facilities/blengil.htm
- Creek Bed Sediments The sediments along the Schoharie Creek show that the creek has changed its course over time.
- Giraffes Giraffes
- Galapagos Turtle Galapagos Turtle
- Zebra Zebra
- Zebras Zebras
- Ostrich Ostrich
- A natural predator of the tomato hornworm is a tiny beneficial insect called the braconid wasp. This wasp lays its eggs inside the hornworm. As they hatch, they eat their way out, killing the hornworm in the process.
- Birds sitting on beach Birds on a beach with waves crashing in
- A natural predator of the tomato hornworm is a tiny beneficial insect called the braconid wasp. This wasp lays its eggs inside the hornworm. As they hatch, they eat their way out, killing the hornworm in the process.
- A natural predator of the tomato hornworm is a tiny beneficial insect called the braconid wasp. This wasp lays its eggs inside the hornworm. As they hatch, they eat their way out, killing the hornworm in the process.
- A natural predator of the tomato hornworm is a tiny beneficial insect called the braconid wasp. This wasp lays its eggs inside the hornworm. As they hatch, they eat their way out, killing the hornworm in the process.
- Tomato Hornworm with Wasp Eggs A natural predator of the tomato hornworm is a tiny beneficial insect called the braconid wasp. This wasp lays its eggs inside the hornworm. As they hatch, they eat their way out, killing the hornworm in the process.
- Pelican flying lone pelican flying through air
- pelicans flying pelicans flying through the clouds
- Birds flying aways some seagulls flying away off beach
- Sea gulls on a beach Sea gulls on a beach
- Portuguese Man o' War Portuguese Man o' War washed up on a beach
- Orange and White Cat Great shot of a friends cat sitting on the couch.
- Tropical Fish Not sure of the species but a cool show with my underwater camera down in Hawaii.
- Tropical Fish Not sure of the species but a cool show with my underwater camera down in Hawaii.
- Stripped Tropical Fish Not sure of the species but a cool show with my underwater camera down in Hawaii.
- Yellow and Black Tropical Fish Not sure of the species but a cool show with my underwater camera down in Hawaii.
- Yellow and Black Tropical Fish Not sure of the species but a cool show with my underwater camera down in Hawaii.
- Woodpecker finch The diagram represents a woodpecker finch.
- Plants and animals The diagram represents many species of plants and animals and their surroundings.
- Average beak sizes of medium ground finch Average beak sizes of the seed-eating medium ground finch on one of the Galapagos Islands are shown in the diagram below. During wet years, all types of seeds are abundant. The medium ground finch prefers to eat small seeds that are easy to crush. However, during droughts (dry years), when small seeds are not as abundant, they eat the larger seeds on the island.
- Large Weapons Explosion Good to show students chemical reactions
- Cool Beakers Here are some beakers reacting to UV light.
- Information about Two Mixtures at 20.°C A student prepared two mixtures, each in a labeled beaker. Enough water at 20.°C was used to make 100 milliliters of each mixture.
- The procedures and corresponding observations for the activities are given A student performed a laboratory activity to observe the reaction between aluminum foil and an aqueous copper(II) chloride solution.
- Periodic Table of Elements Periodic Table of Elements
- Transmission Tower Transmission Tower
- Lightning Great Lightning Shot
- particle about to enter the electric field The diagram below represents a positively charged particle about to enter the electric field between two oppositely charged parallel plates.
- electric field strength Two parallel metal plates are connected to a variable source of potential difference. When the potential difference of the source is increased, the magnitude of the electric field strength between the plates increases. The diagram shows an electron located between the plates.
- circuit The diagram represents a circuit consisting of two resistors connected to a source of potential difference.
- magnetic field lines The diagram shows the magnetic field lines between two magnetic poles, A and B.
- Prism Refracting White Light Prism Refracting White Light
- Einstein Einstein contributed more than any other scientist to the modern vision of physical reality. His special and general theories of relativity are still regarded as the most satisfactory model of the large-scale universe that we have.
- Speed vs Time The graph shows the relationship between the speed and elapsed time for an object falling freely from rest near the surface of a planet.
- Conservation of Energy and Motion Pedagogical Tool Demonstrating Conservation of Energy and Motion, ca. 1890
- horizontal, frictionless surface Two forces act concurrently on an object on a horizontal, frictionless surface, as shown in the diagram.
- open box and its contents As shown in the diagram, an open box and its contents have a combined mass of 5.0 kilograms. A horizontal force of 15 newtons is required to push the box at a constant speed of 1.5 meters per second across a level surface.
- Water Tank The diagram represents a view from above of a tank of water in which parallel wave fronts are traveling toward a barrier.
- child pulls a wagon A child pulls a wagon at a constant velocity along a level sidewalk. The child does this by applying a 22-newton force to the wagon handle, which is inclined at 35° to the sidewalk as shown below.
- Researcher with Test Tube Researcher with Test Tube
- Laboratory technique A laboratory technique is represented in the diagram.
- protein banding patterns A change in hemoglobin, a protein found in red blood cells, causes sickle-cell disease. Hemoglobin samples from different individuals can be compared by using a specific technique. The protein banding patterns of three samples are shown.
- Cactus This small cactus is over 150 years old. This species grows extremely slowly in the desert.
- Cactus Cactus centered in a desert environment.
- Orange Flower Not sure species of flower, but its orange ;-)
- Seaweed Seaweed that washed up on the beach.
- White flower with Wasp Here is a white flower found in Alaska that has what looks like to be a wasp on it.
- Aerial Shot of Coral Reef under water This is a shot showing the massive coral reef systems in place. Notice the darker color within the water, those are the actual reefs.
- Evolutionary Tree of Life Nice chart to show the evolution of life.
- Ear Schematic of inside the human ear.
- Antibody / Antigen An activity that occurs in the human body is shown.
- DNA Background on DNA
- DNA molecule Four different segments of a DNA molecule are represented.
- Darwin Charles Darwin: Very Gradual Change We Can Believe In
- Sexual Reproduction Overview of sexual reproduction.
- human reproductive system The diagram represents part of a human reproductive system.
- Cell View of a normal cell and one infected with cancer.
- Cell of a green plant The diagram represents a cell of a green plant.
- Two molecules, A and B, and their distribution Two molecules, A and B, and their distribution inside and outside of a cell are represented in the diagram.
- Marine System Impact The colors indicate levels of human impact, with cooler shades representing lower levels of impact than warmer shades, which represent higher levels of impact.
- Food chain The diagram represents a food chain made up of organisms found in a field.
- Food web food web
- Species Extinctions Since 1800 The graph shows the number of species that became extinct from 1800 to 2000. It also shows estimates of the number of species that will become extinct between 2000 and 2020.
- balanced equation balanced equation
- formula representing a compound formula representing a compound
- Reaction of Zn(s) with HCl(aq) During a laboratory activity to investigate reaction rate, a student reacts 1.0-gram samples of solid zinc with 10.0-milliliter samples of HCl(aq). The table below shows information about the variables in five experiments the student performed.
- Bright-Line Spectra The bright-line spectra for three elements and a mixture of elements are shown
- Ionic Radii of Some Group 2 Elements The ionic radii of some Group 2 elements are given in the table
- Reaction between bromine and a hydrocarbon A reaction between bromine and a hydrocarbon is represented by the balanced equation
- Concentrations of Reactants and Products At 550°C, 1.00 mole of CO2(g) and 1.00 mole of H2(g) are placed in a 1.00-liter reaction vessel. The substances react to form CO(g) and H2O(g). Changes in the concentrations of the reactants and the concentrations of the products are shown in the graph
- Component of Natural Gas vs. Boiling Point at Standard Pressure (°C) Natural gas is a mixture that includes butane, ethane, methane, and propane. Differences in boiling points can be used to separate the components of natural gas. The boiling points at standard pressure for these components are listed in the table
- displacement of a particle The graph represents the displacement of a particle in a medium over a period of time.
- standing wave The diagram represents a standing wave
- two waves traveling in the same medium The diagram shows two waves traveling in the same medium. Points A, B, C, and D are located along the rest position of the medium. The waves interfere to produce a resultant wave.
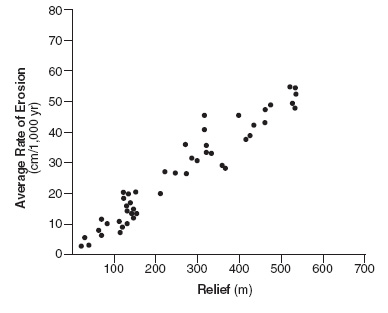
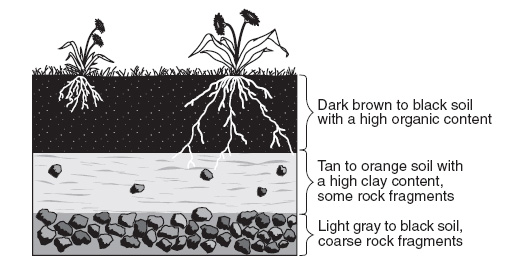
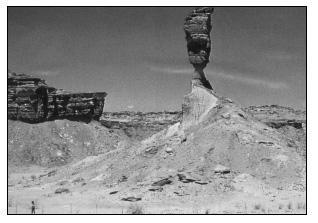
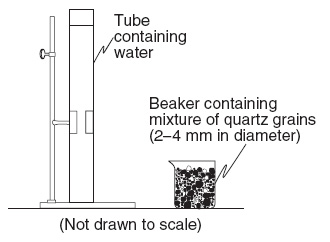
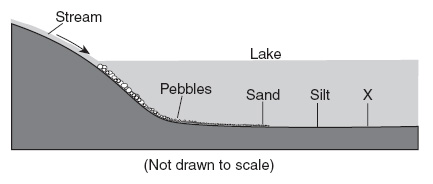
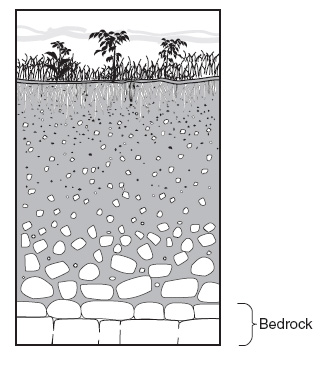
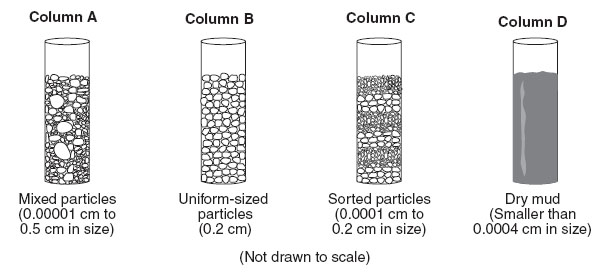
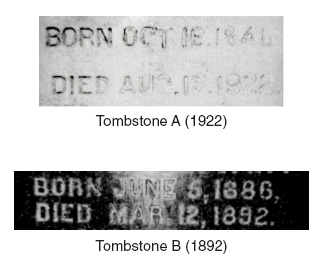
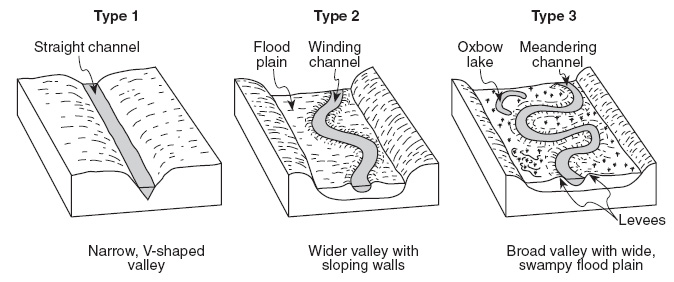
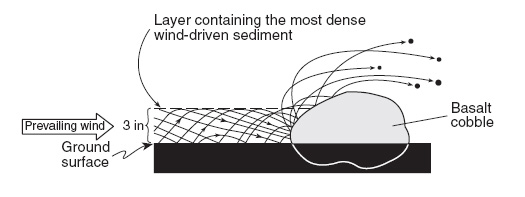
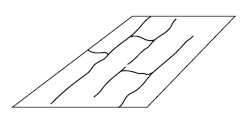
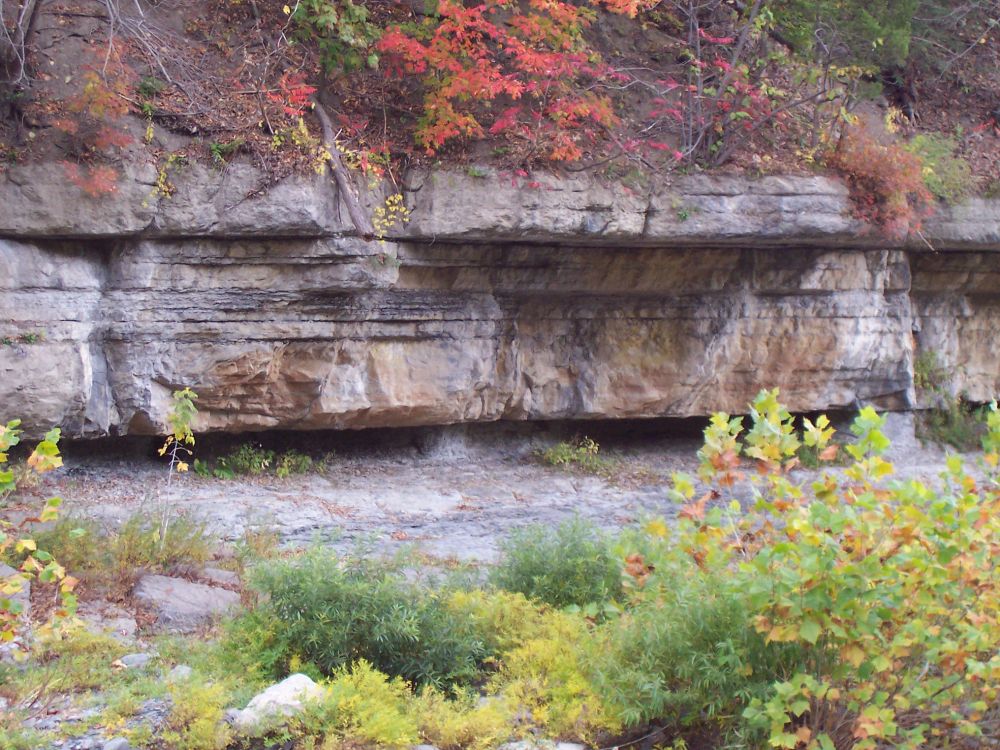
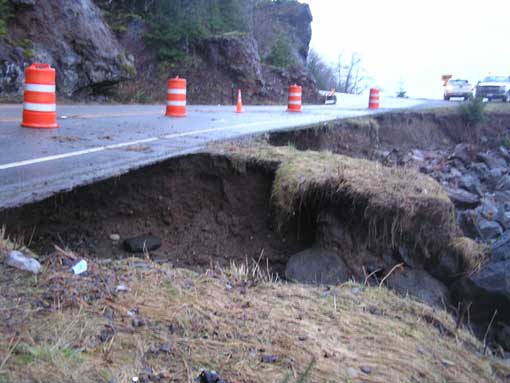
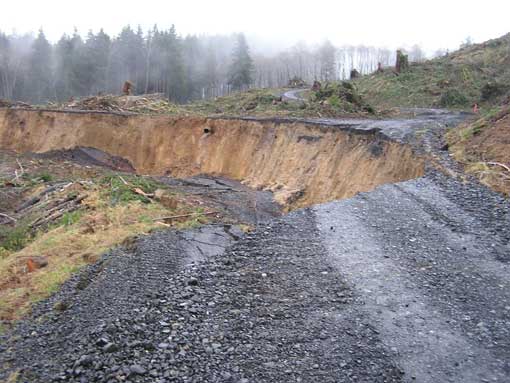
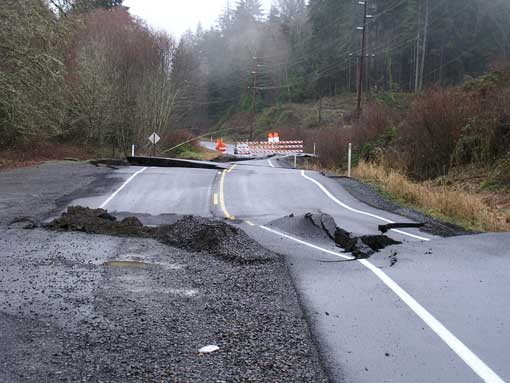
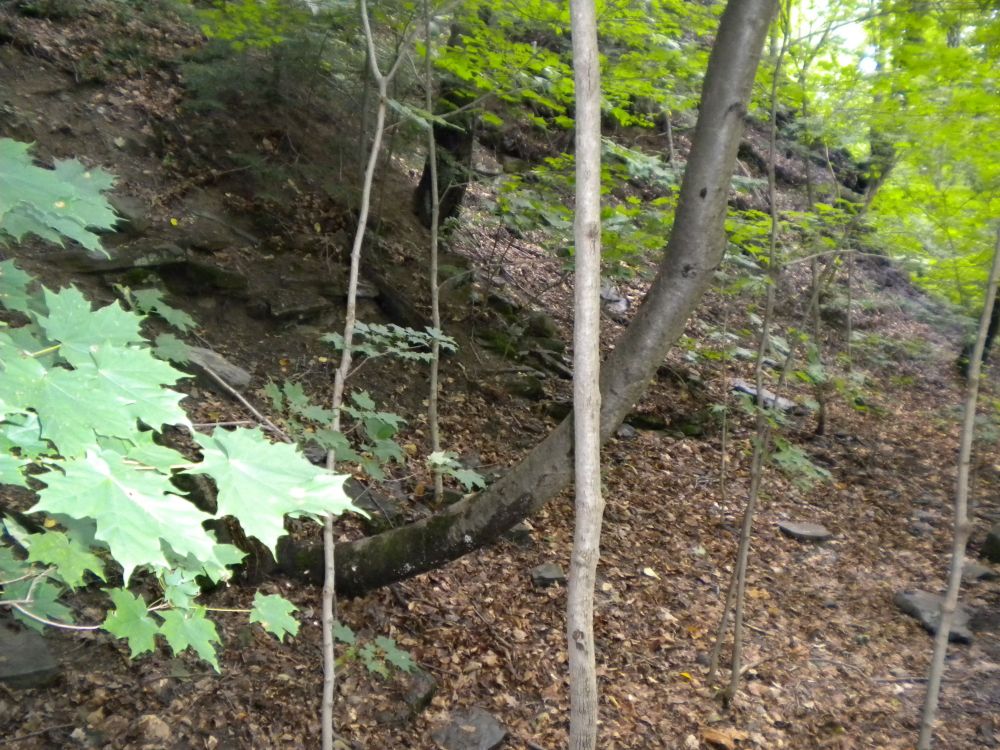
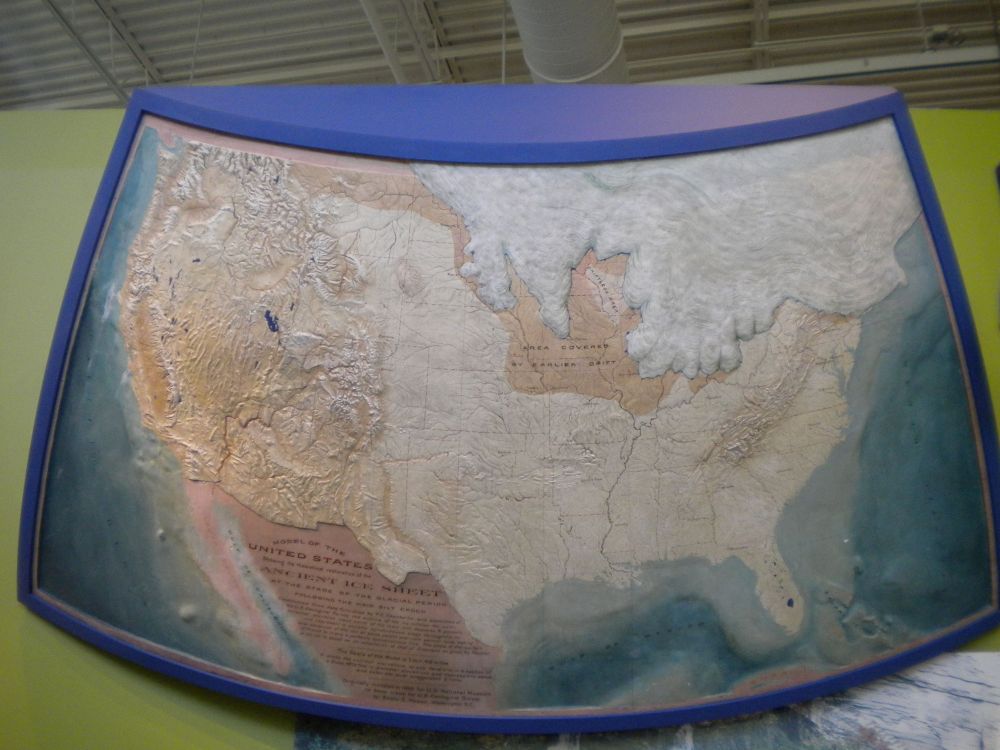
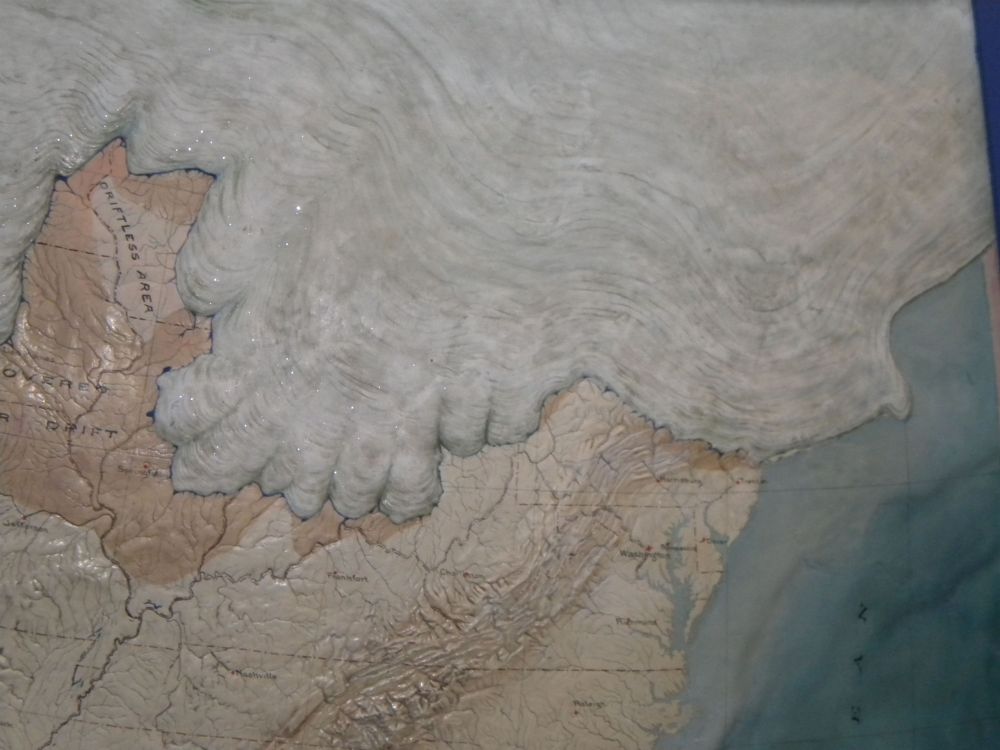
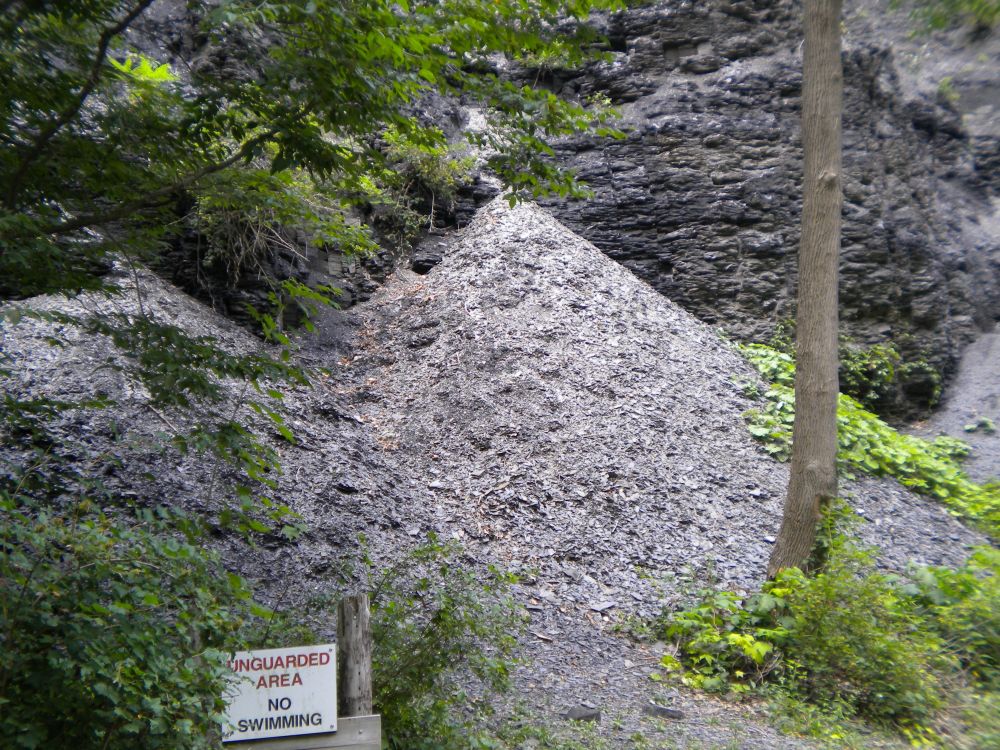
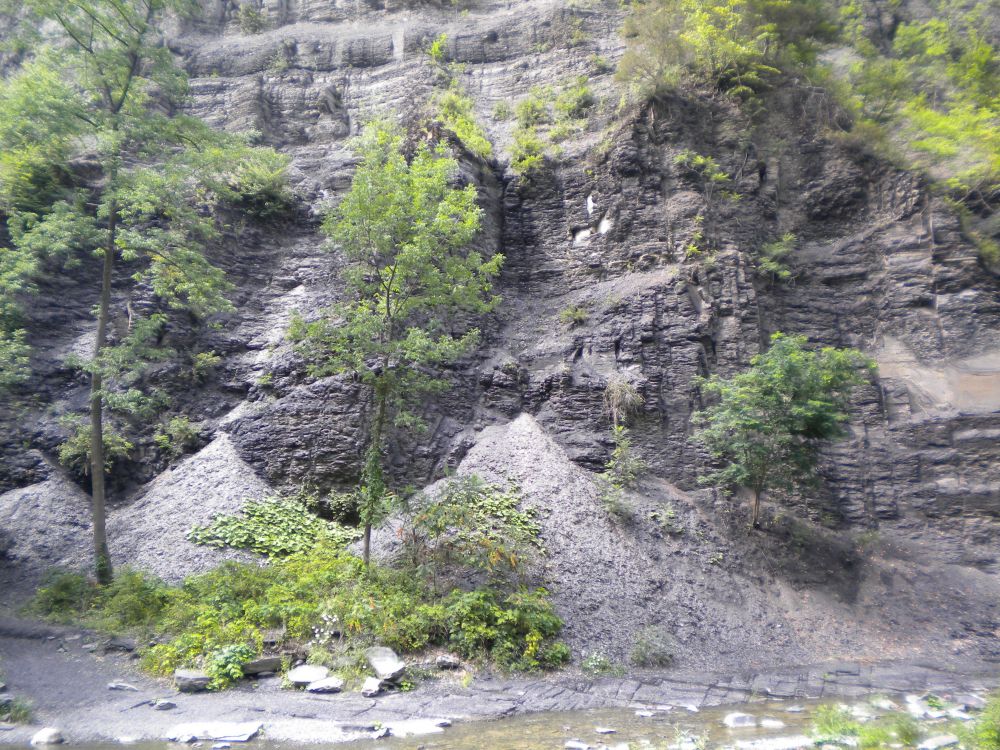
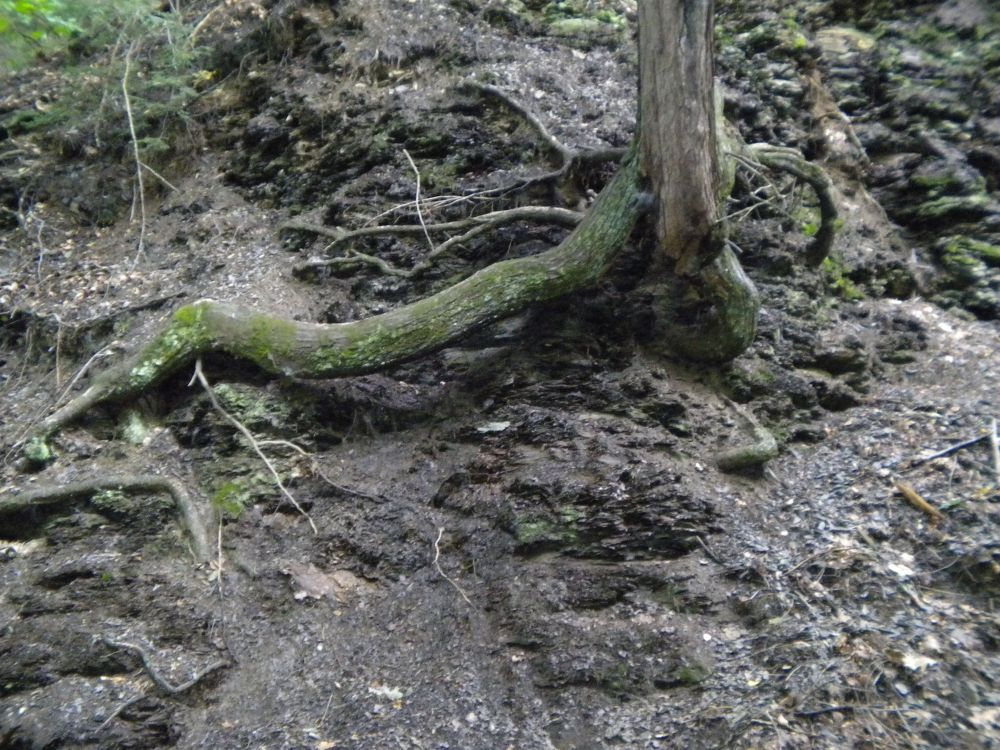
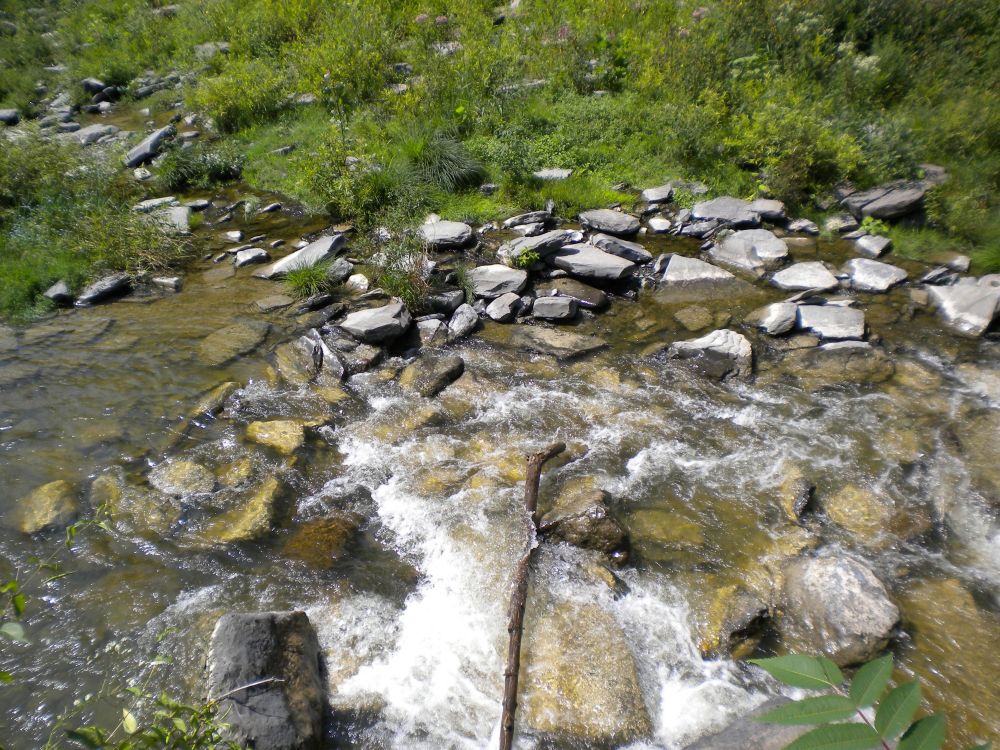
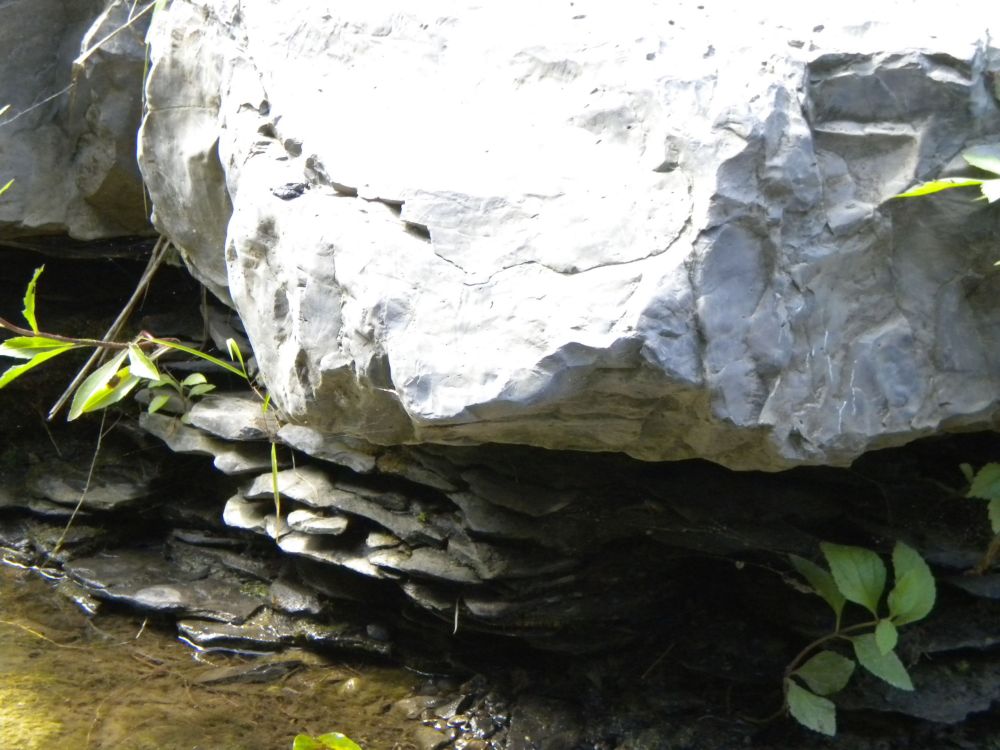
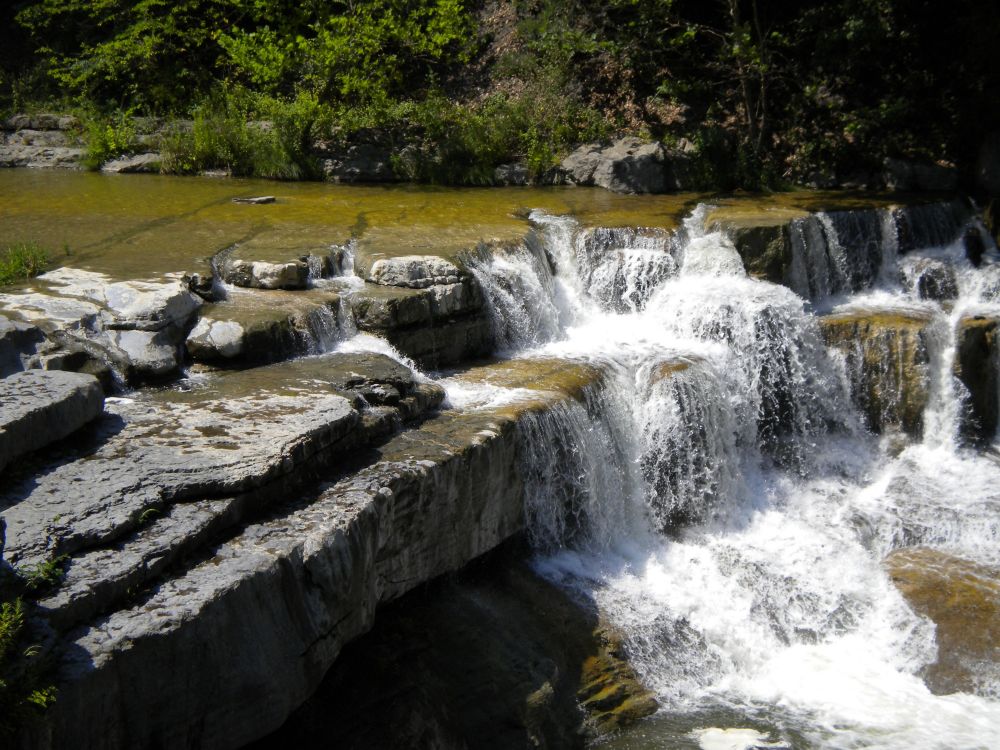
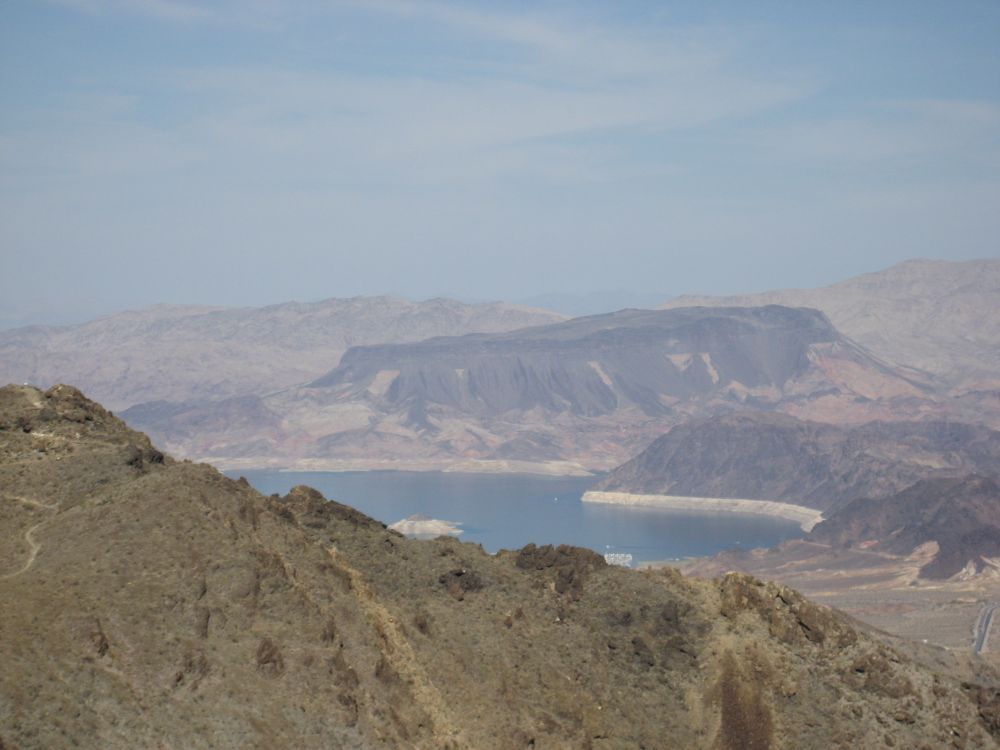
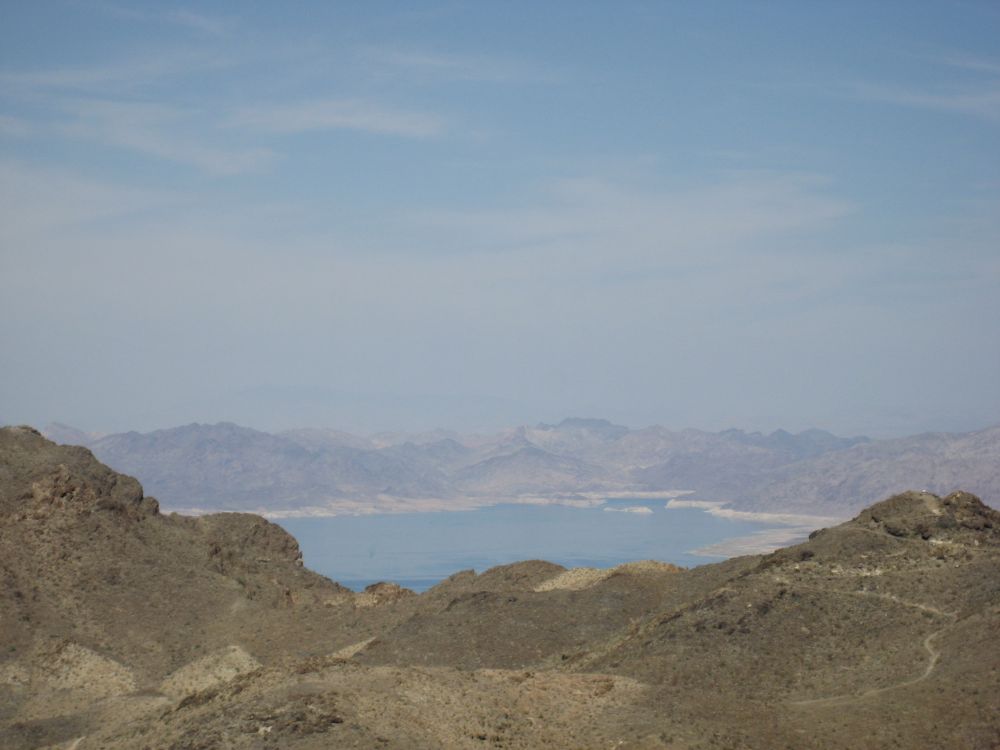
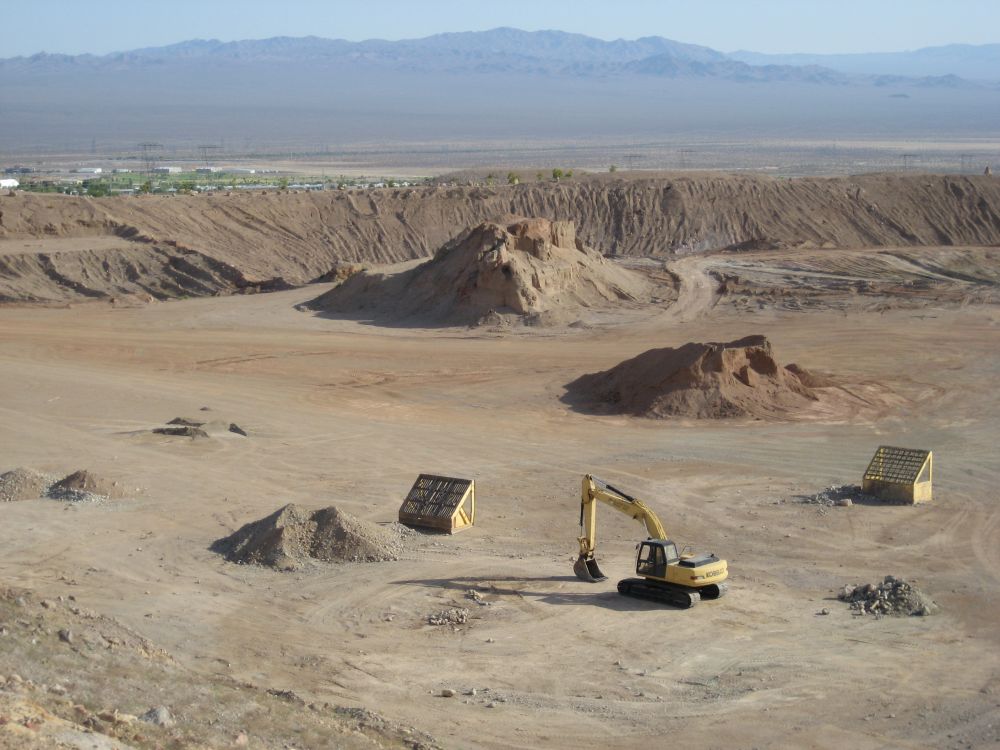
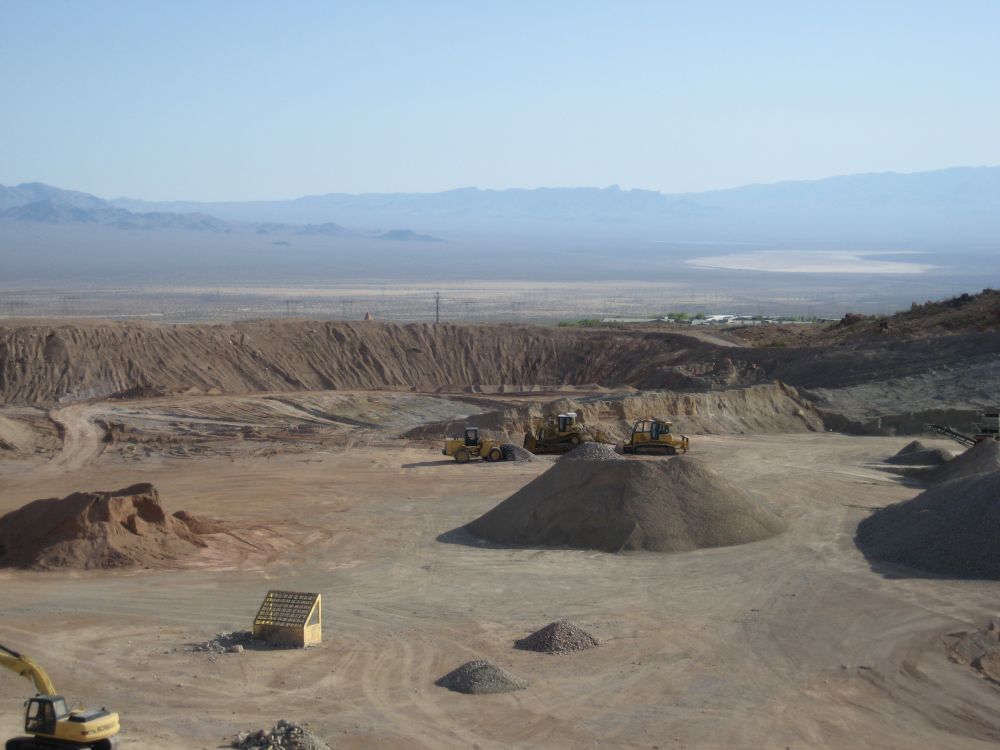
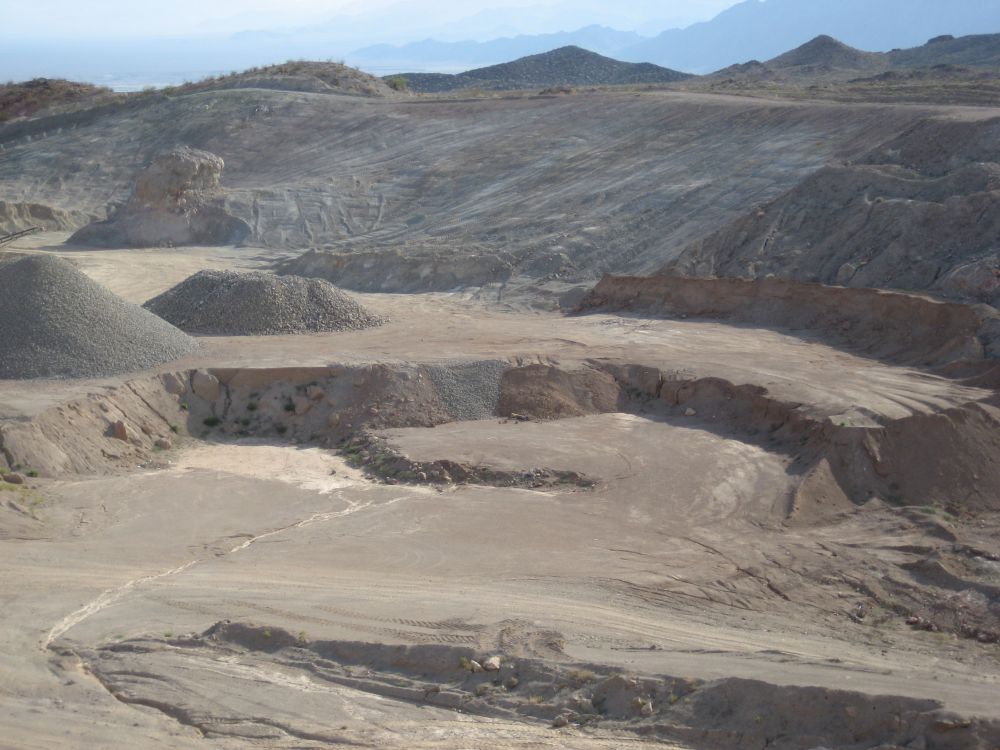
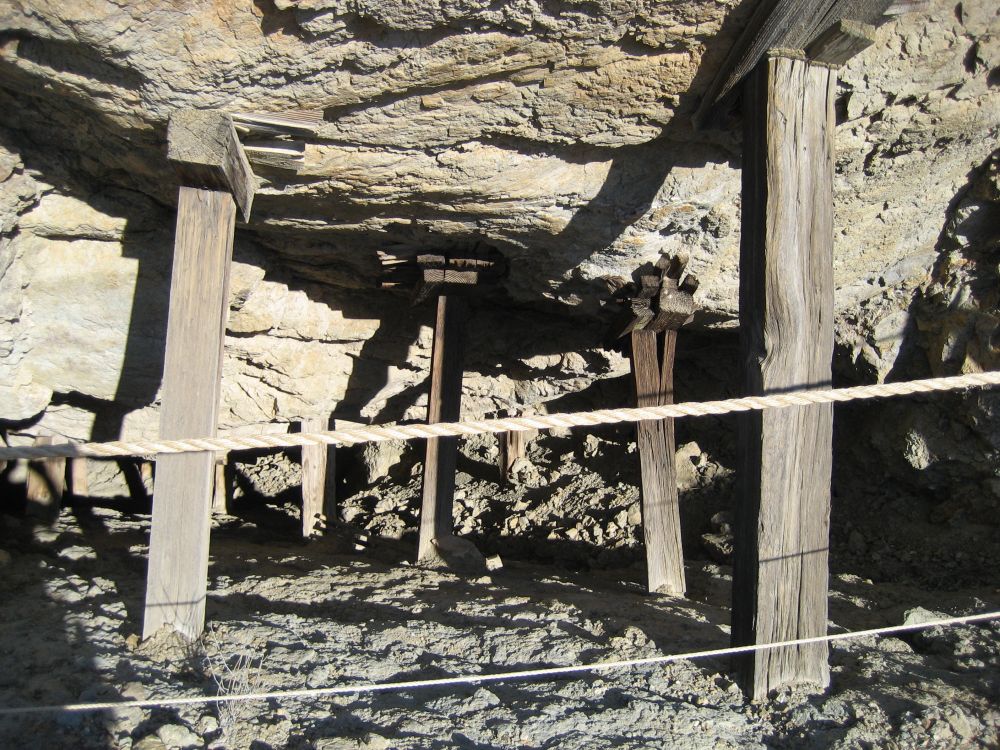
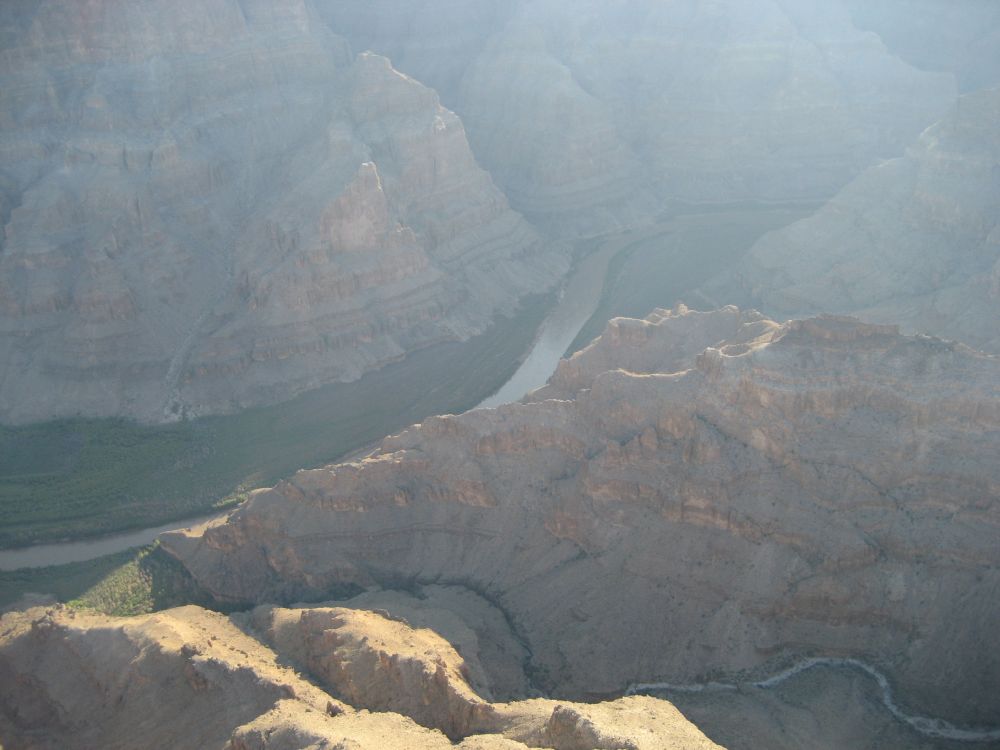
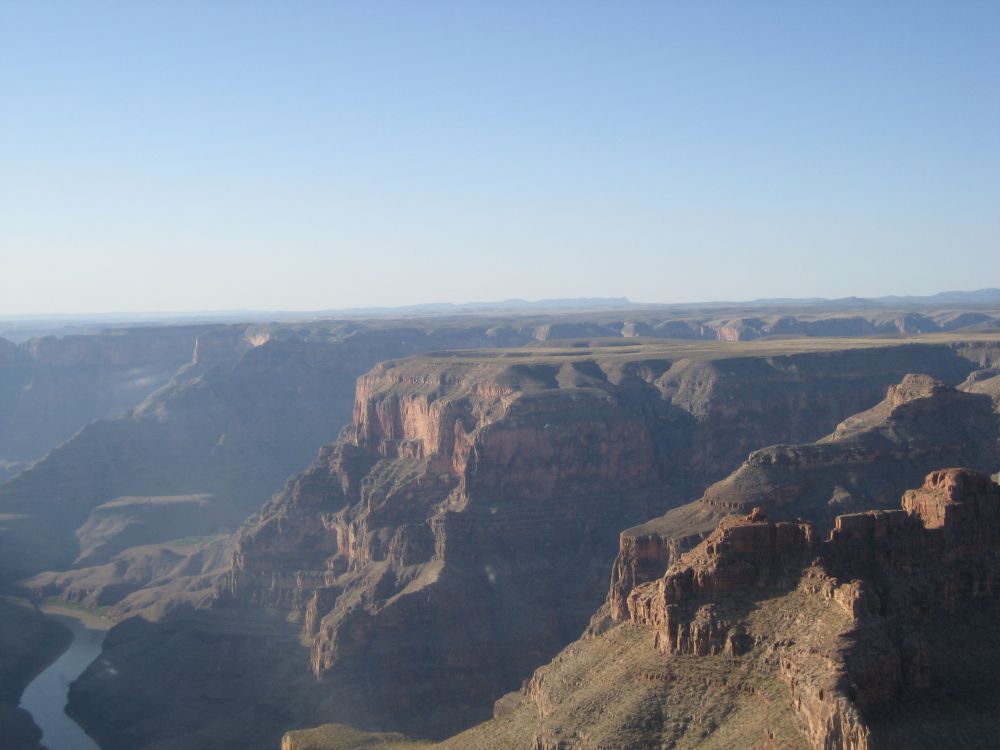
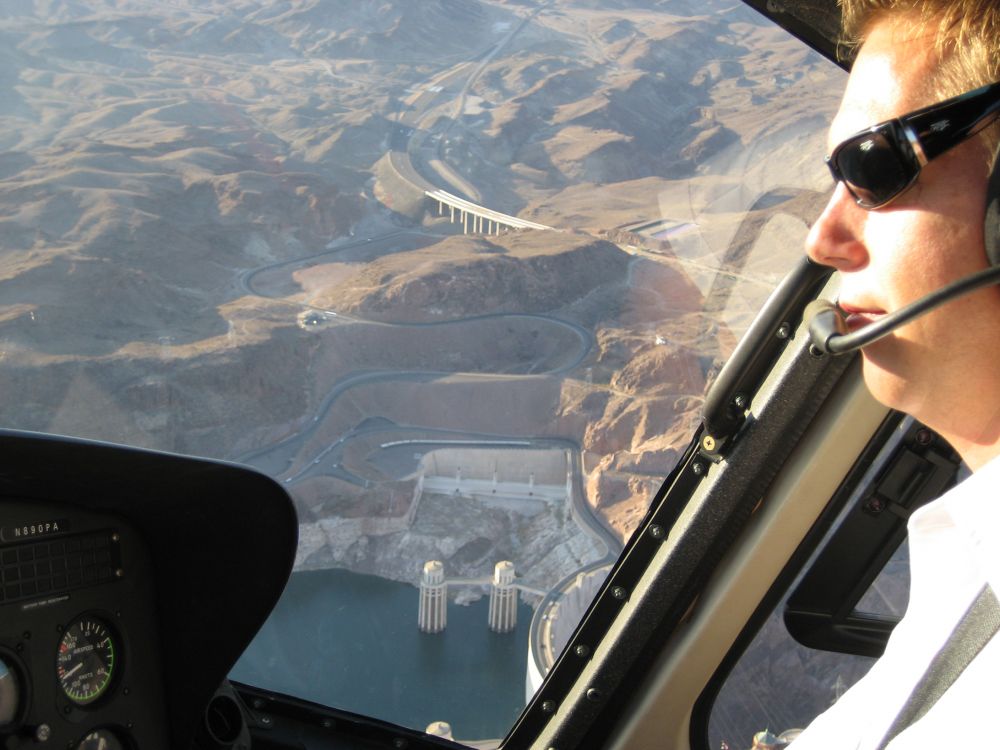
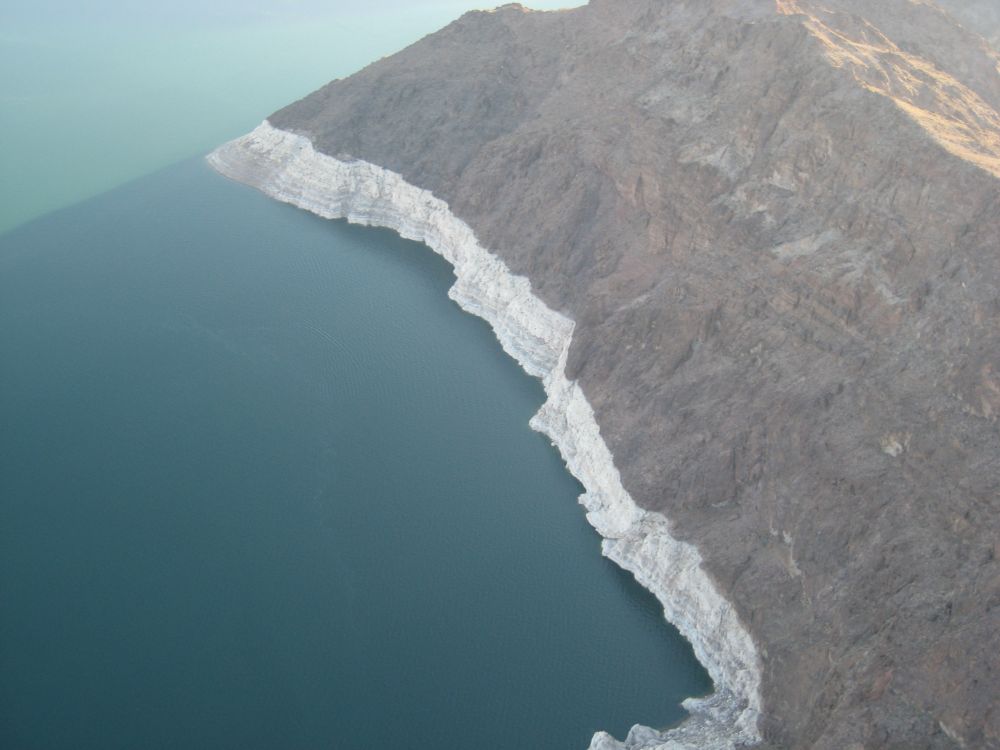
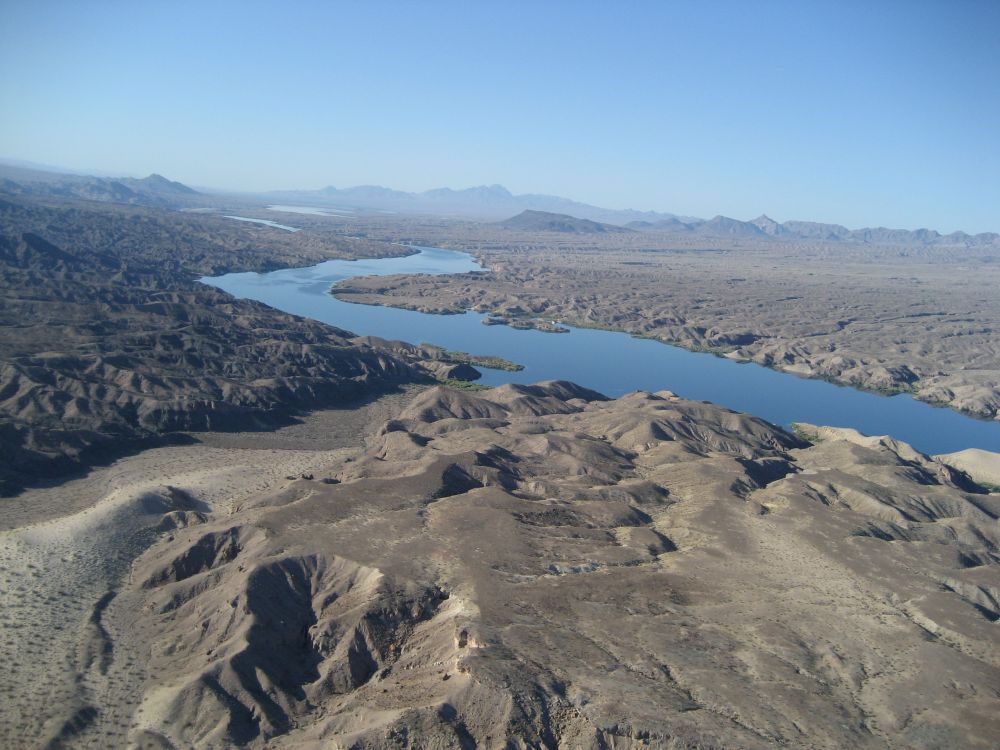
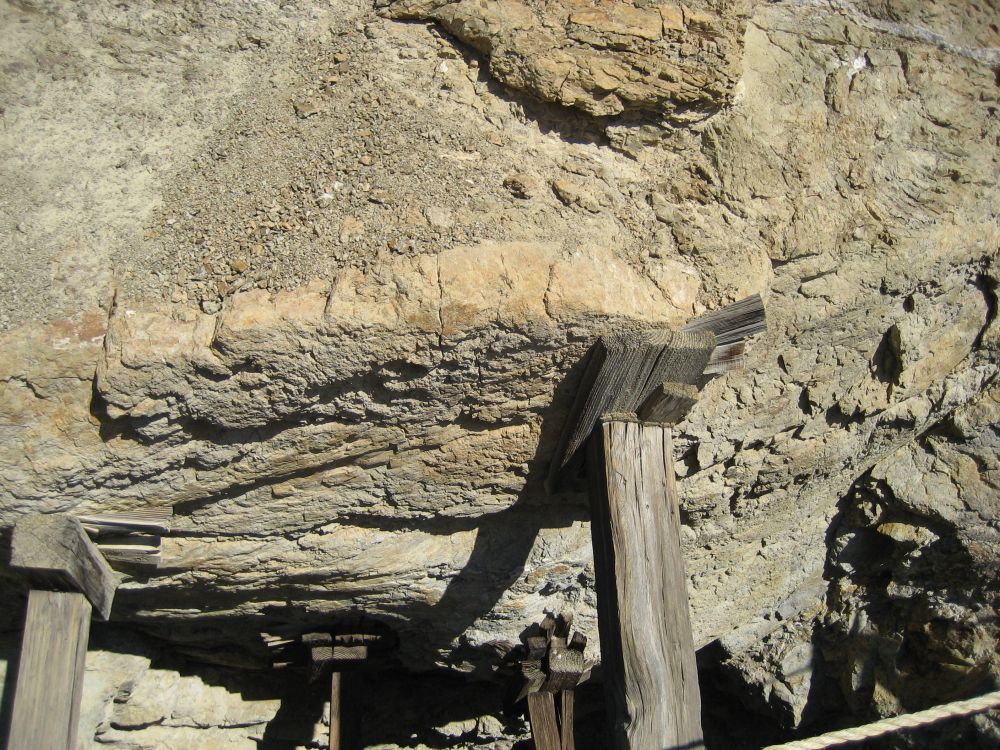
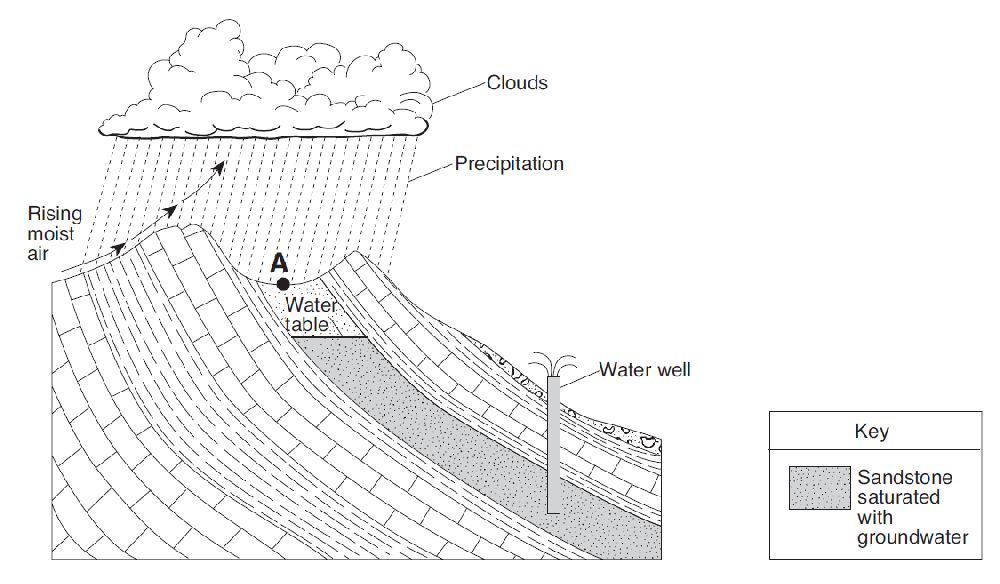
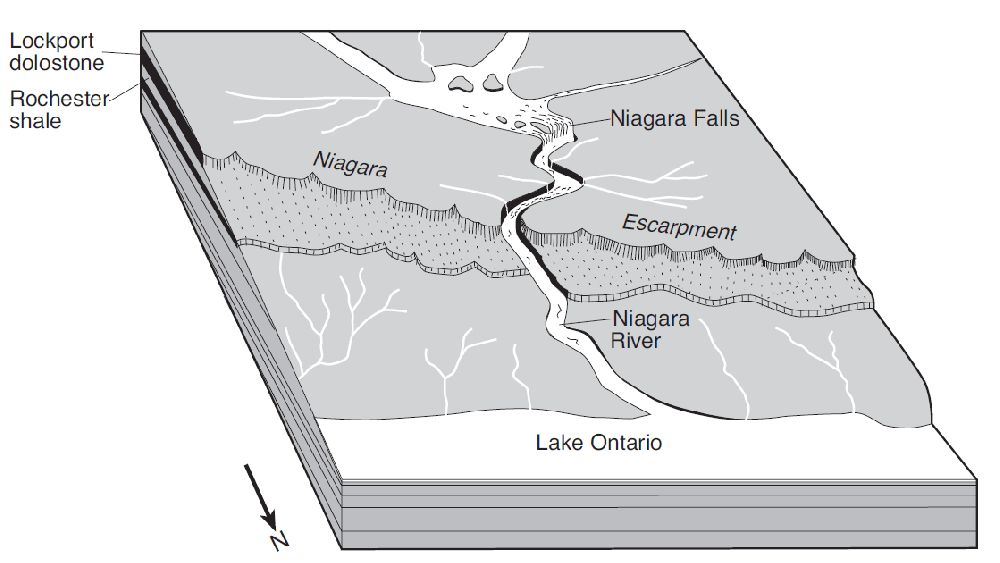
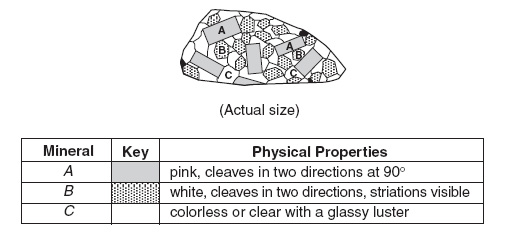
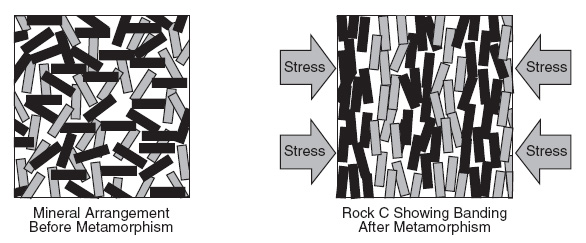
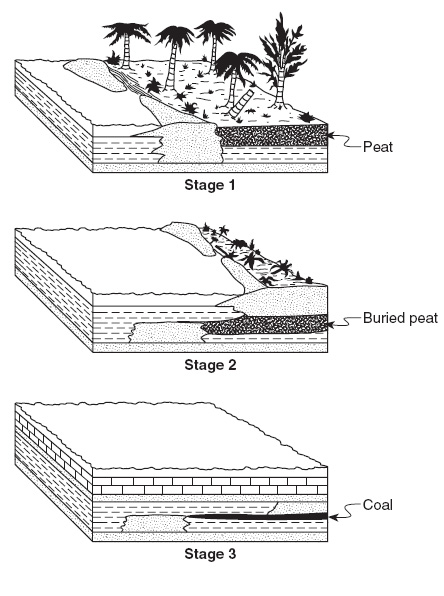
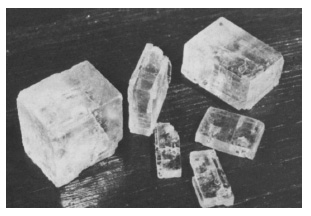
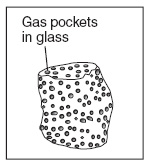
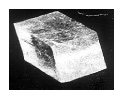
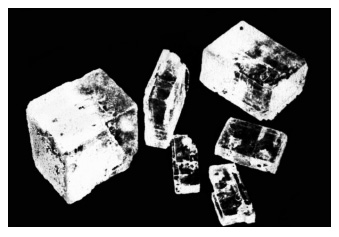
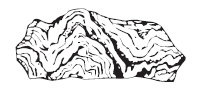
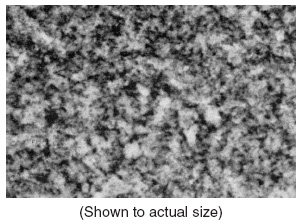
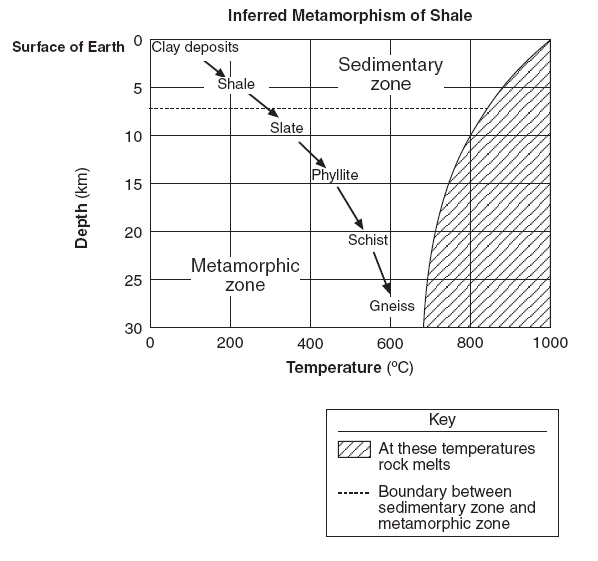
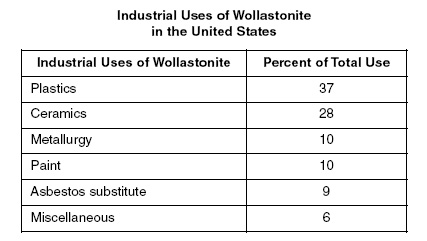
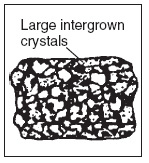
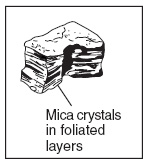
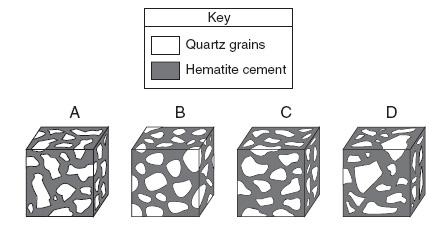
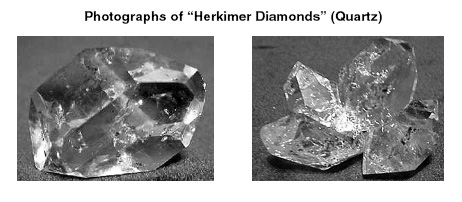
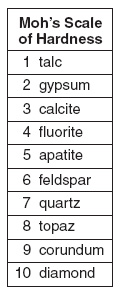
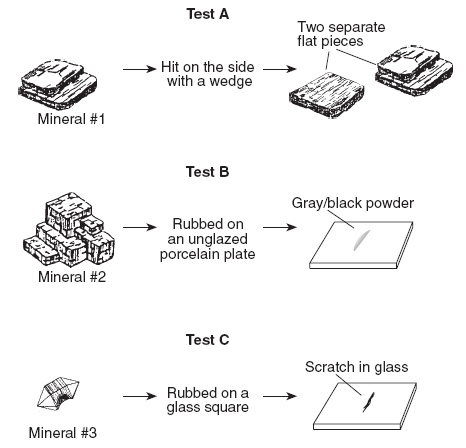
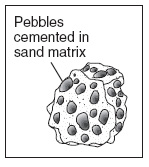
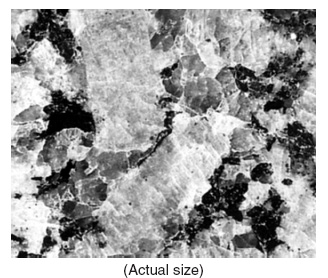
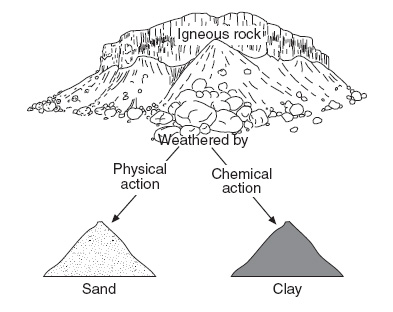
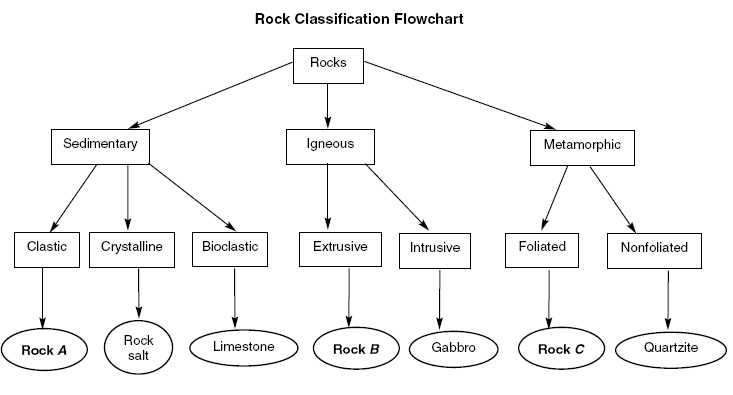
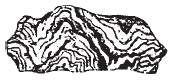
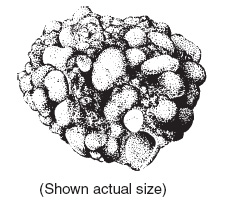
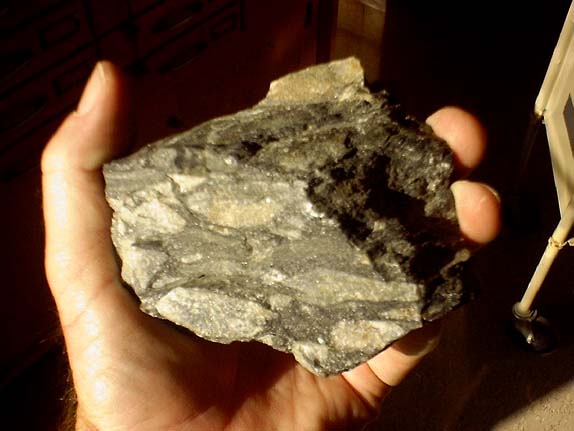
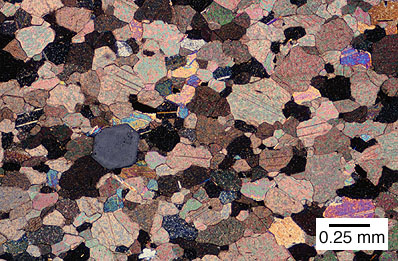
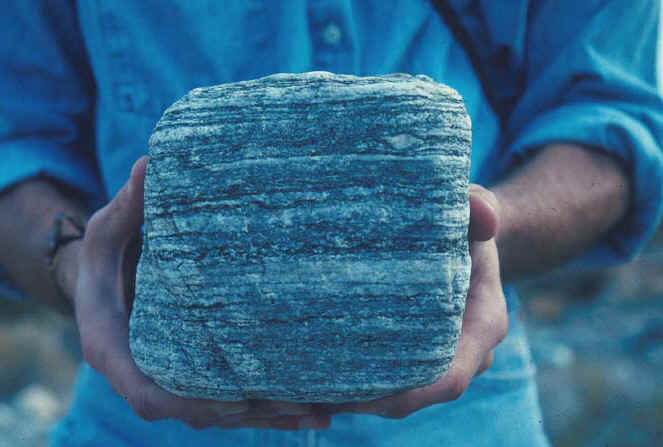
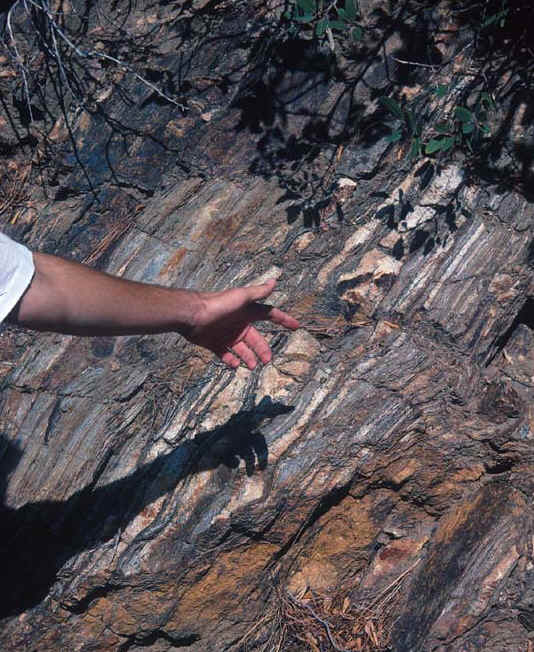
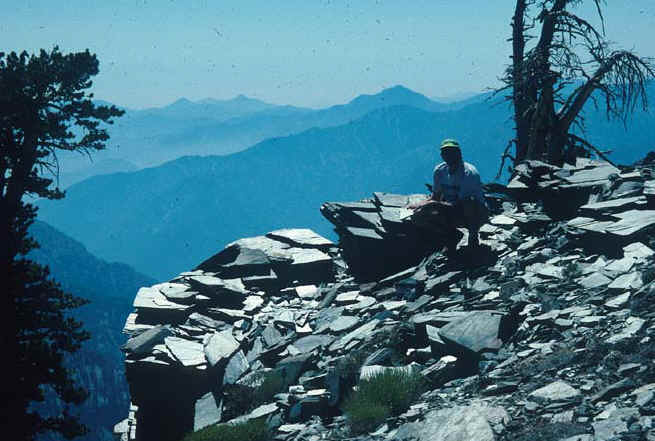
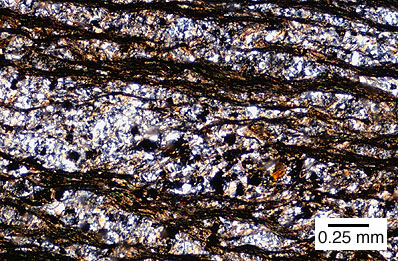
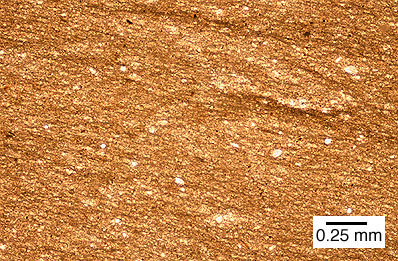
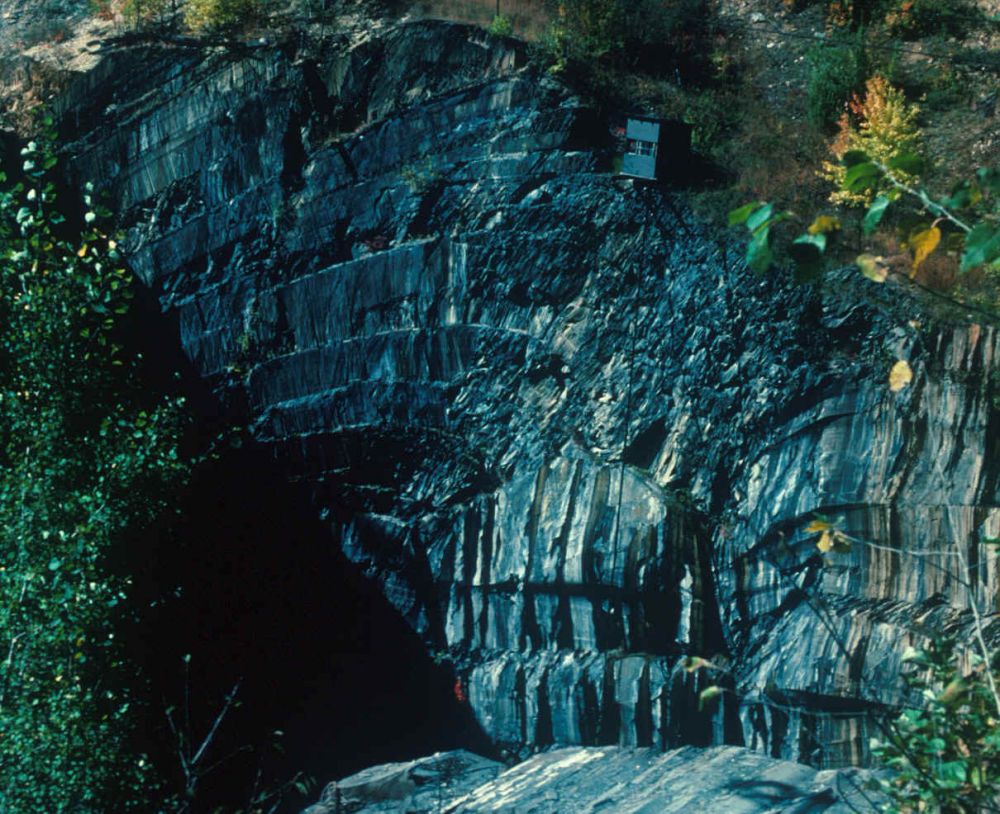
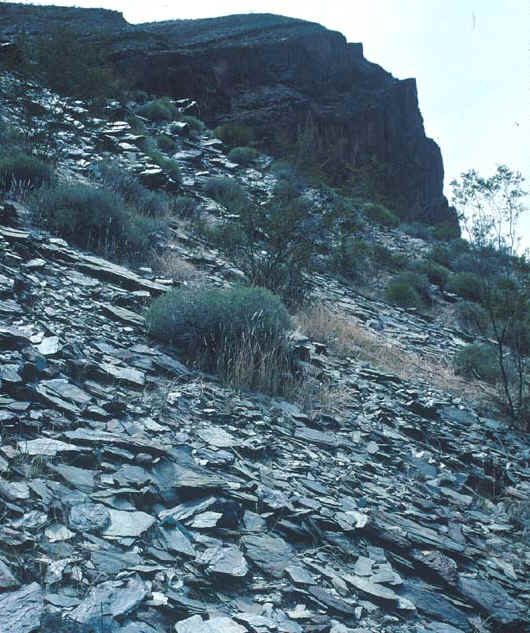
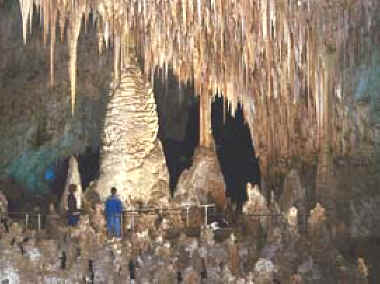
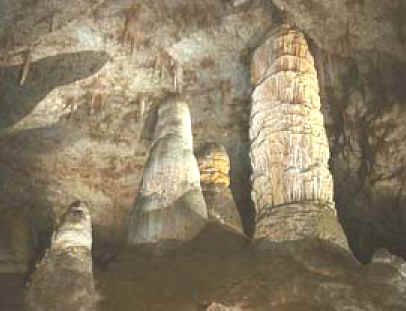
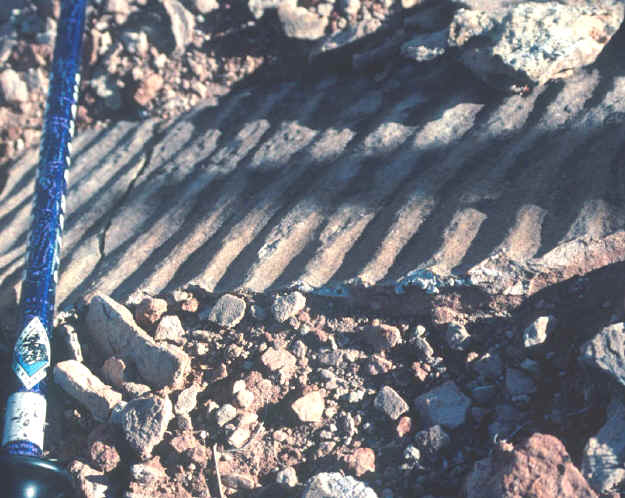
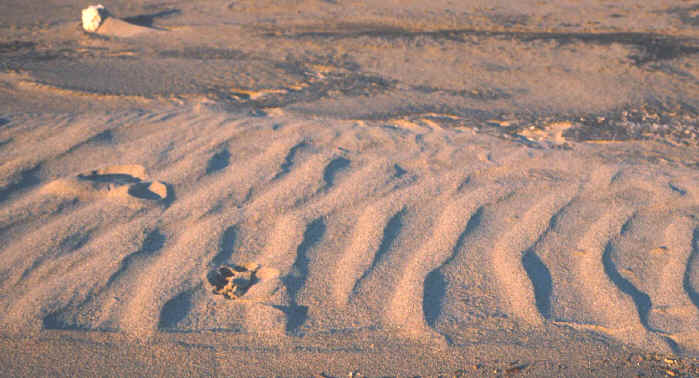
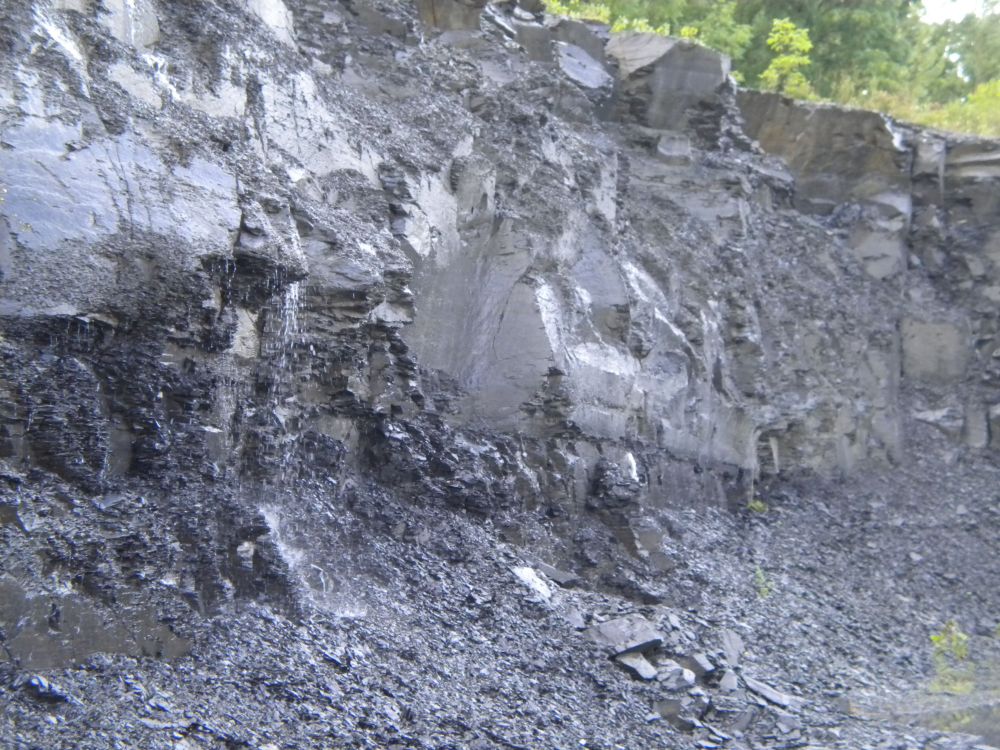
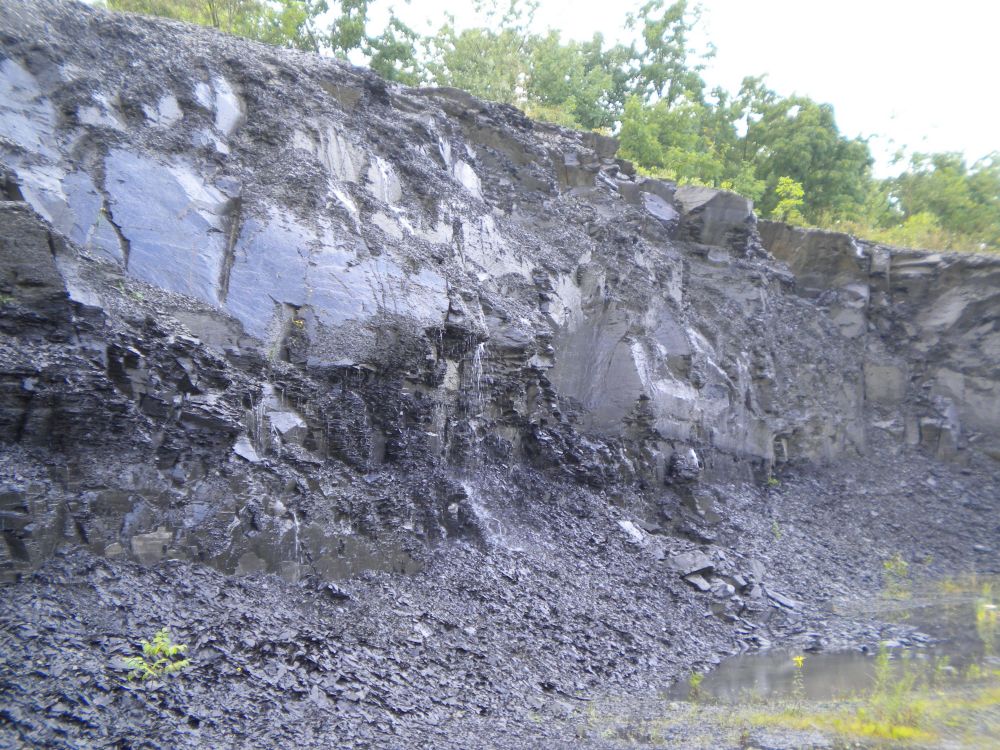
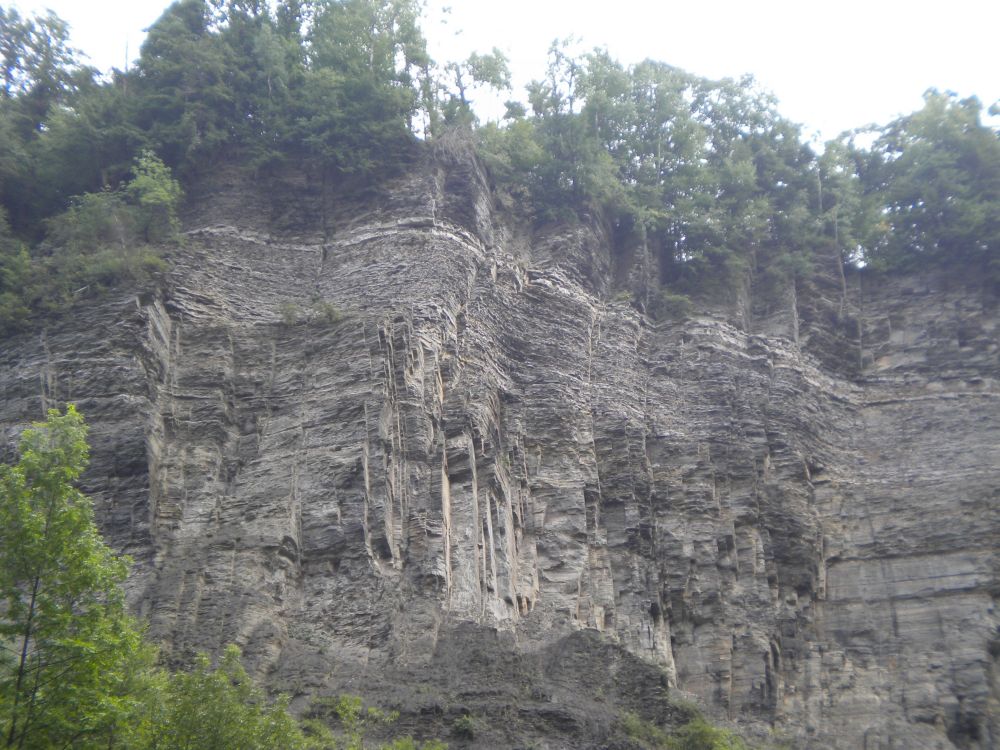
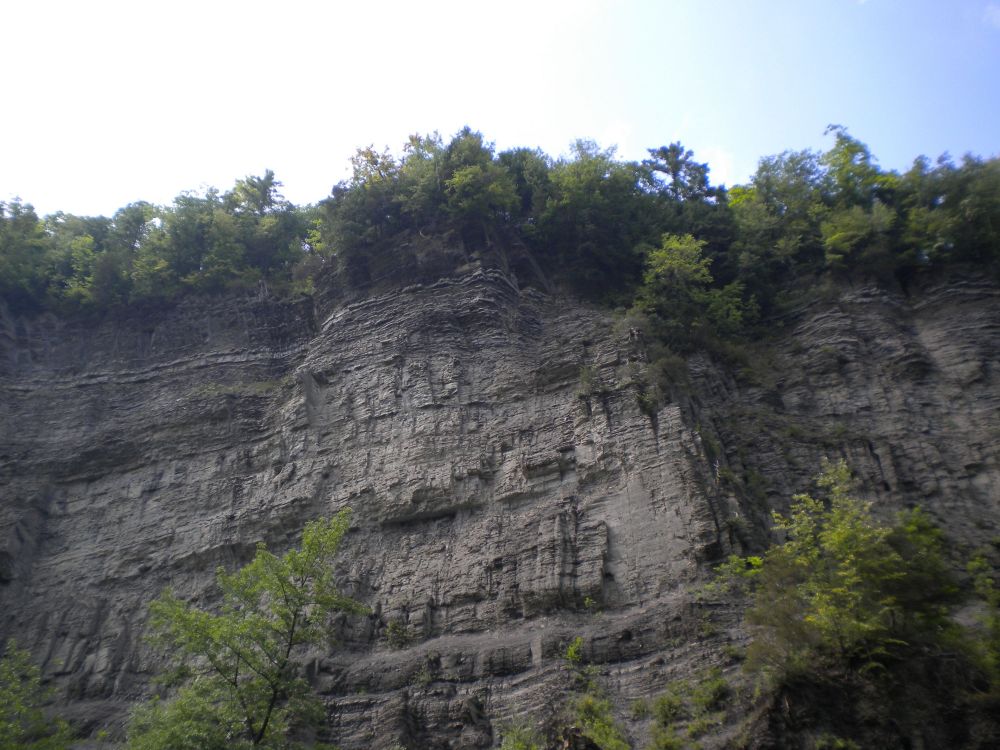
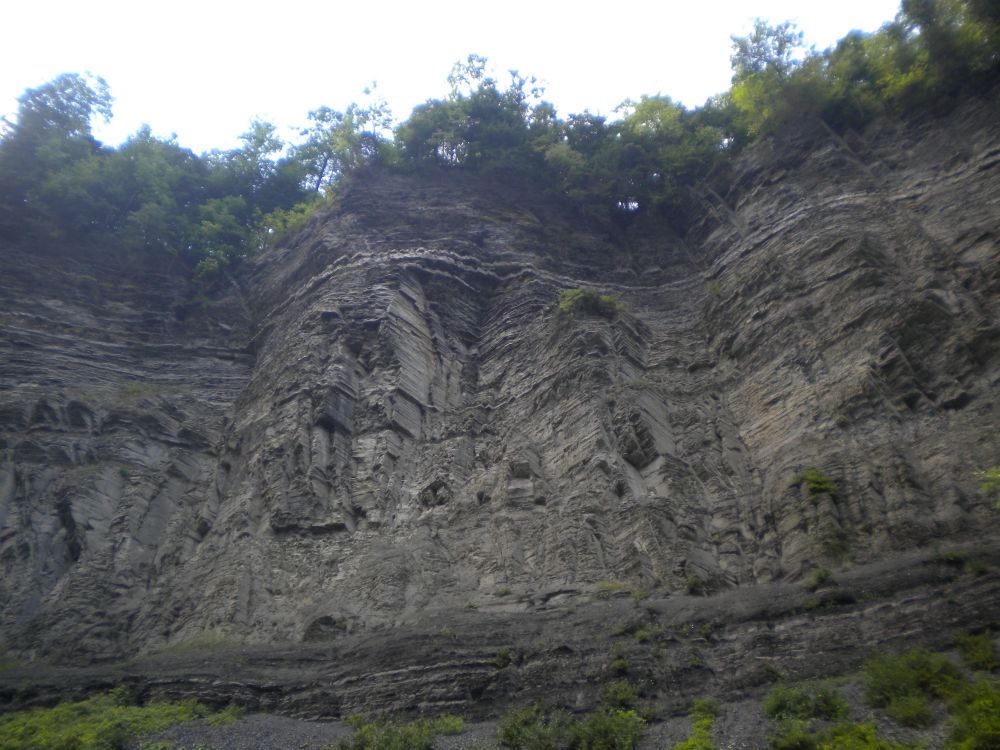
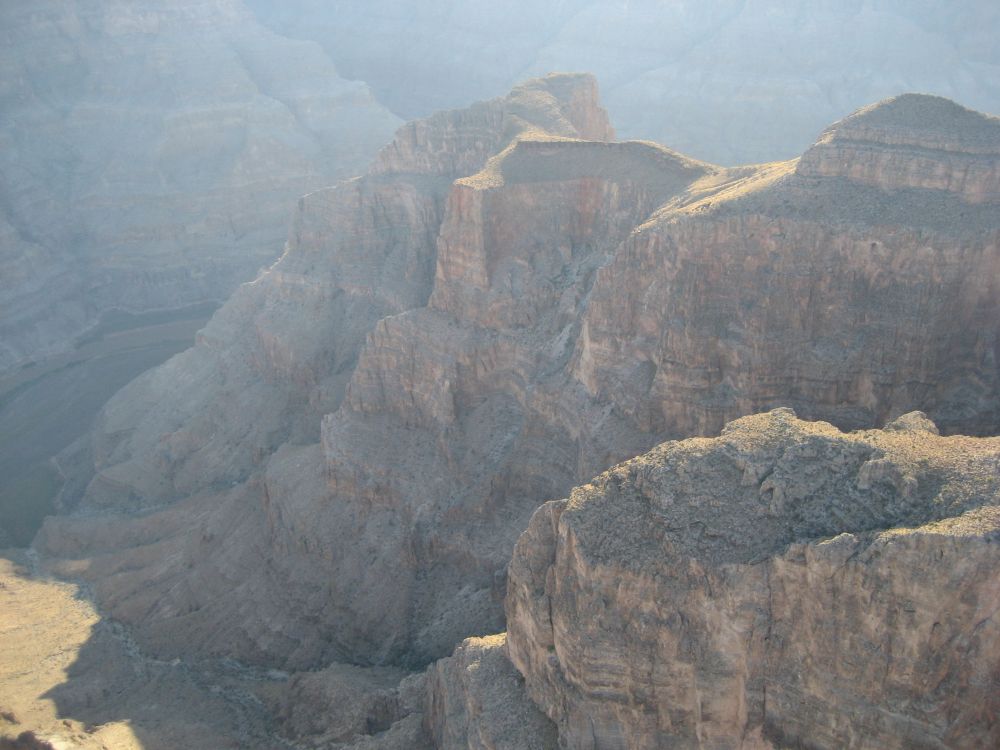
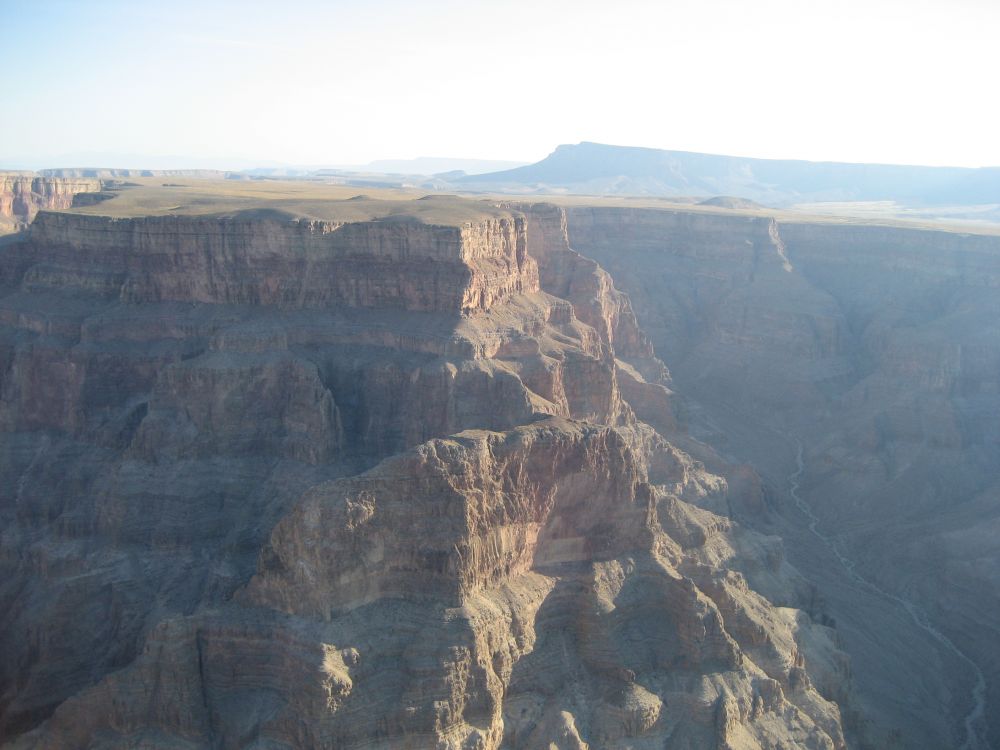
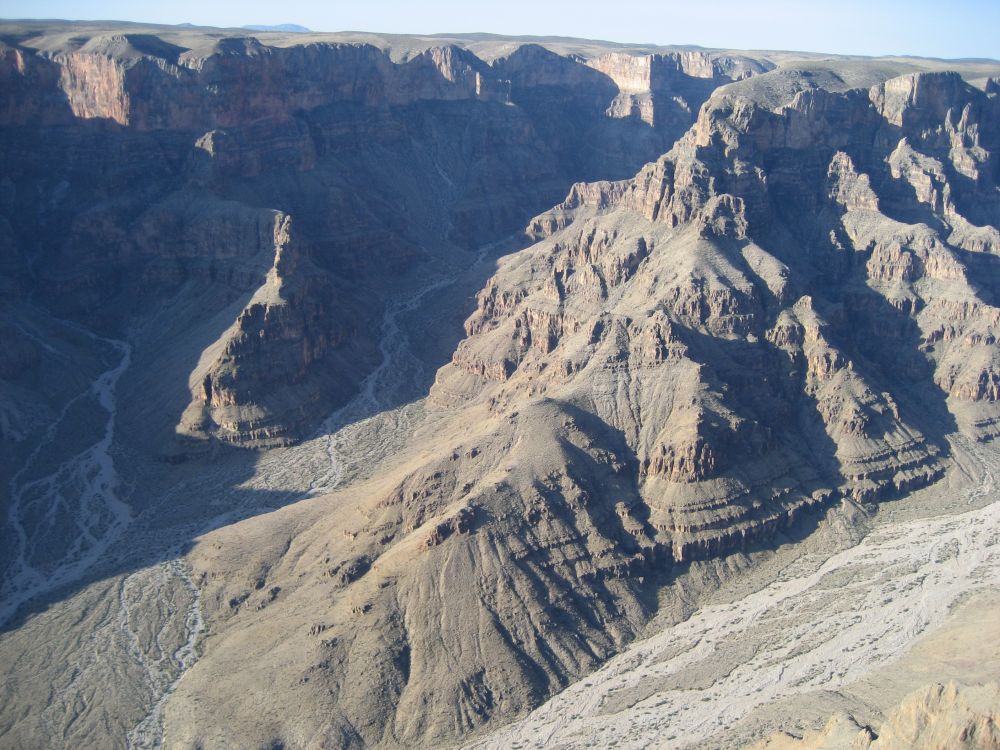
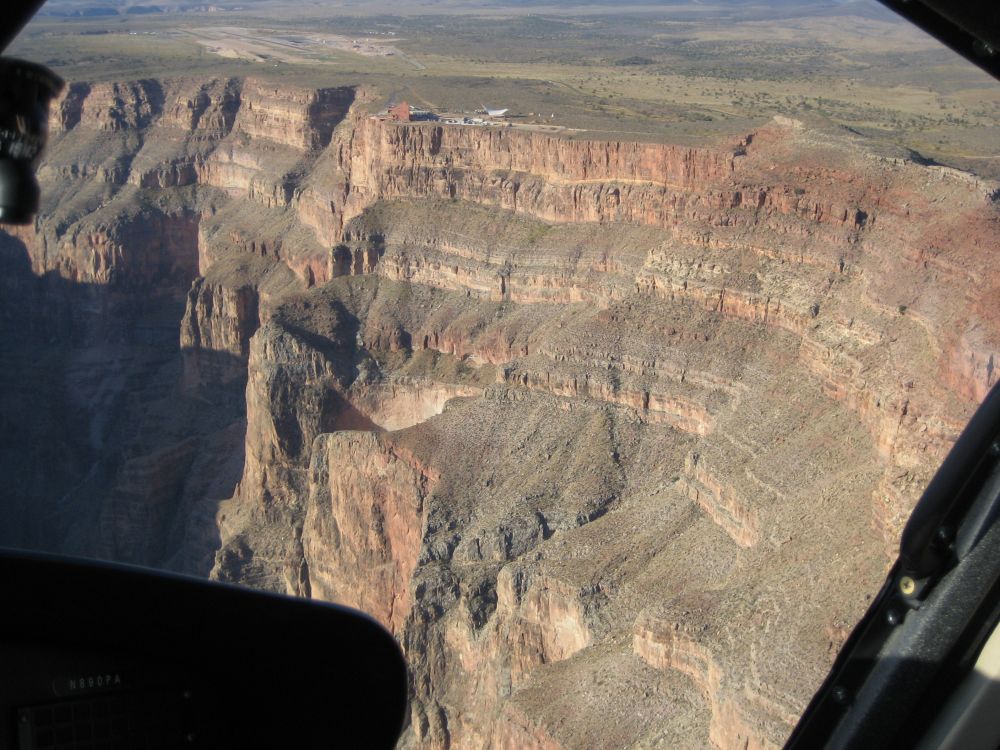
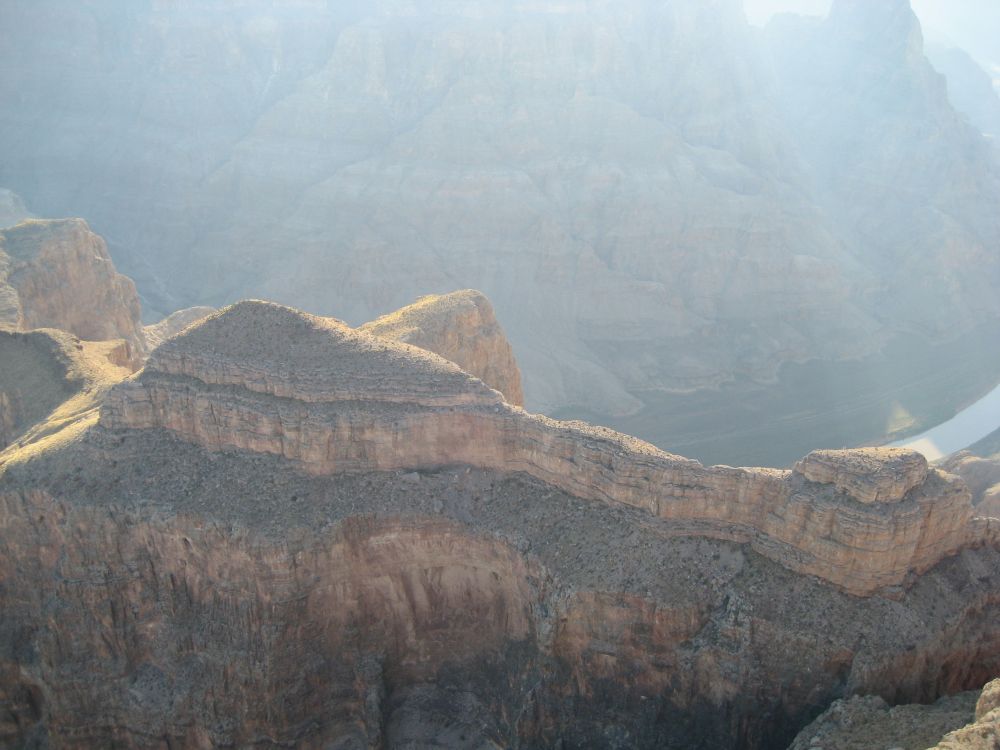
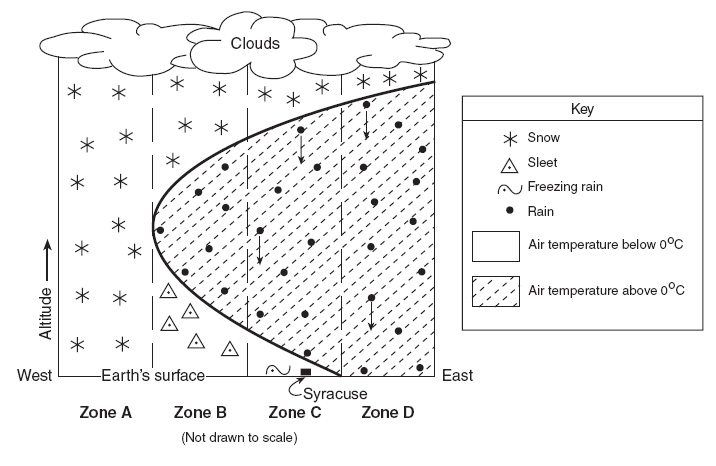
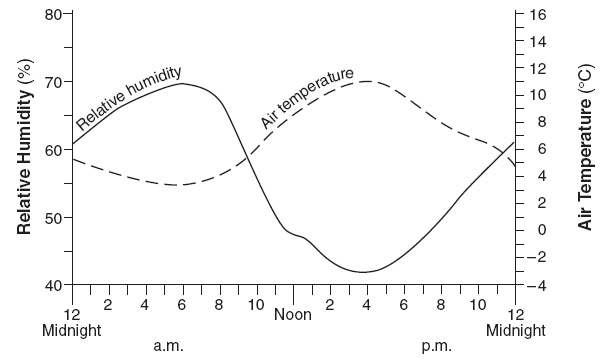
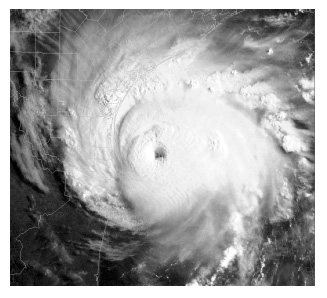
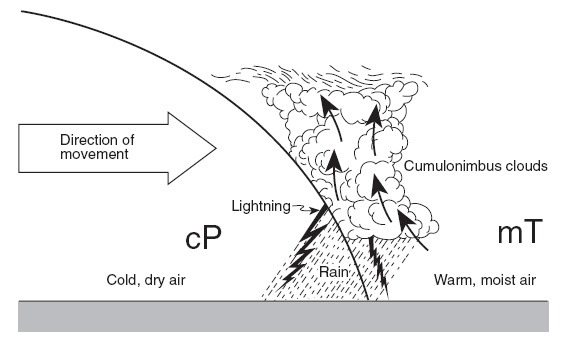
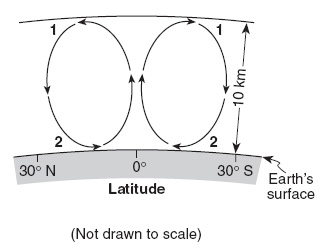
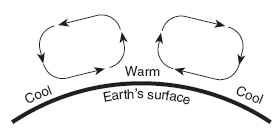
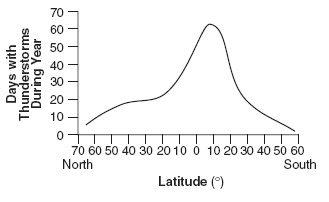
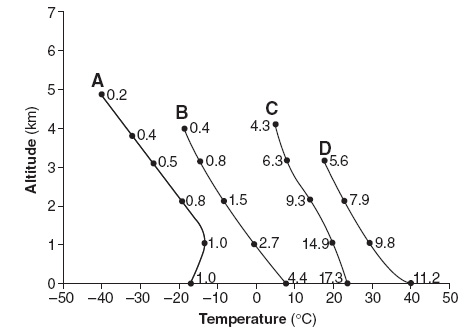
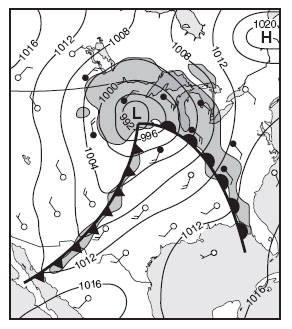
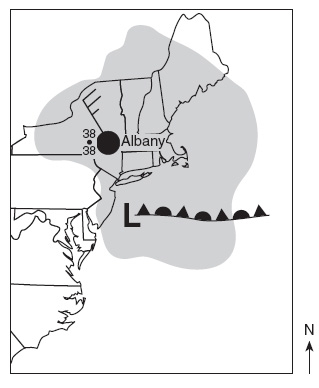
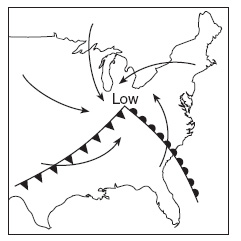
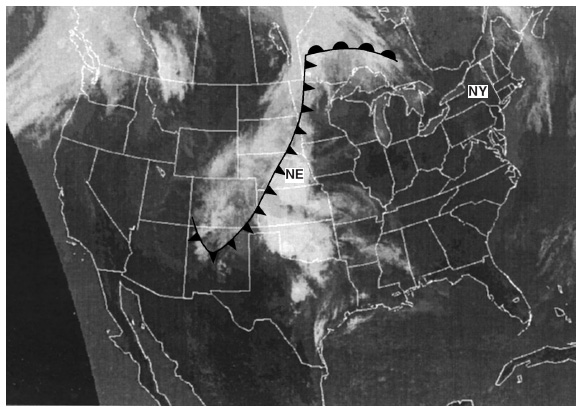
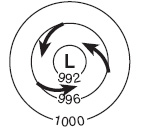
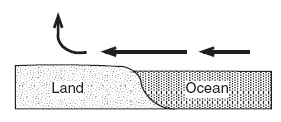
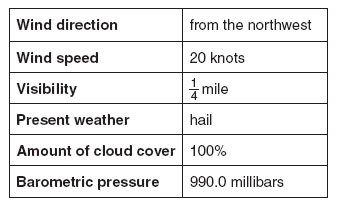
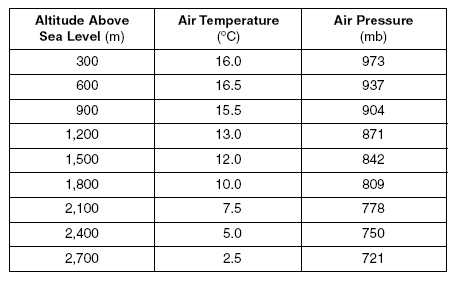
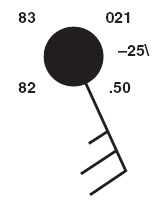
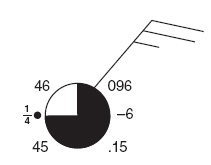
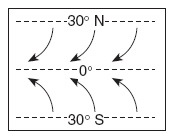
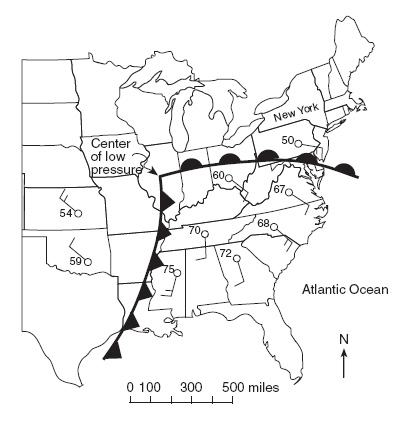
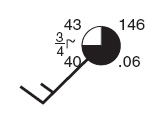
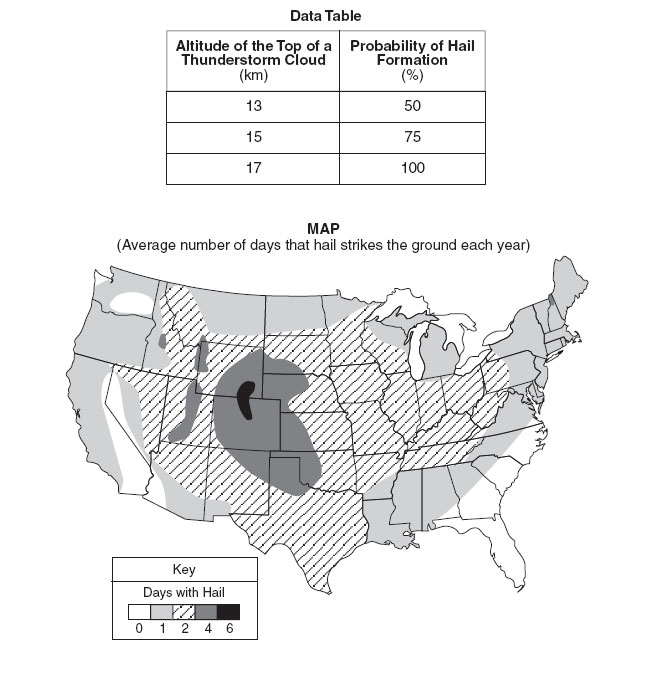
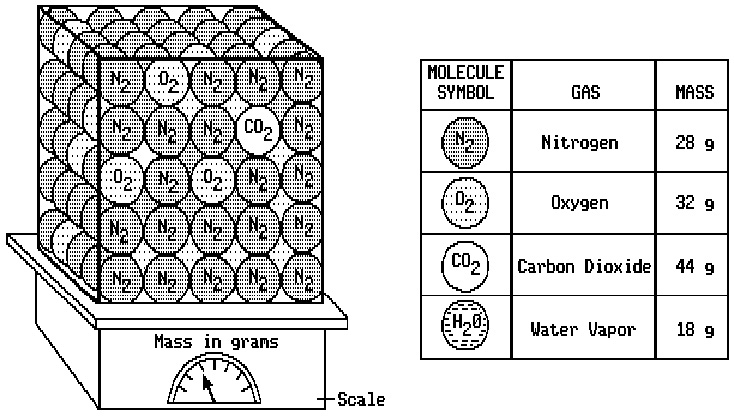
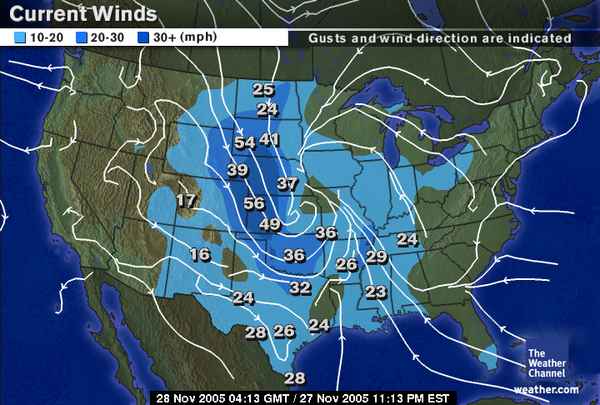
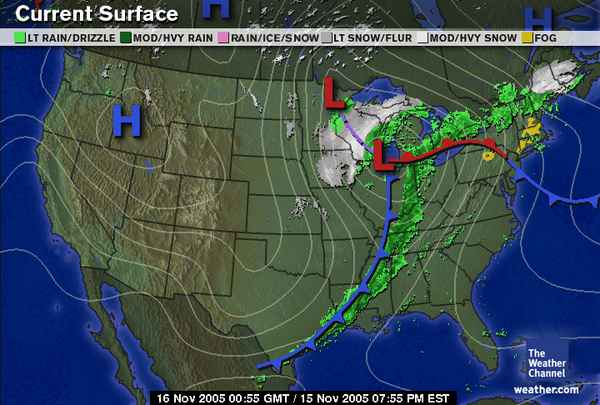
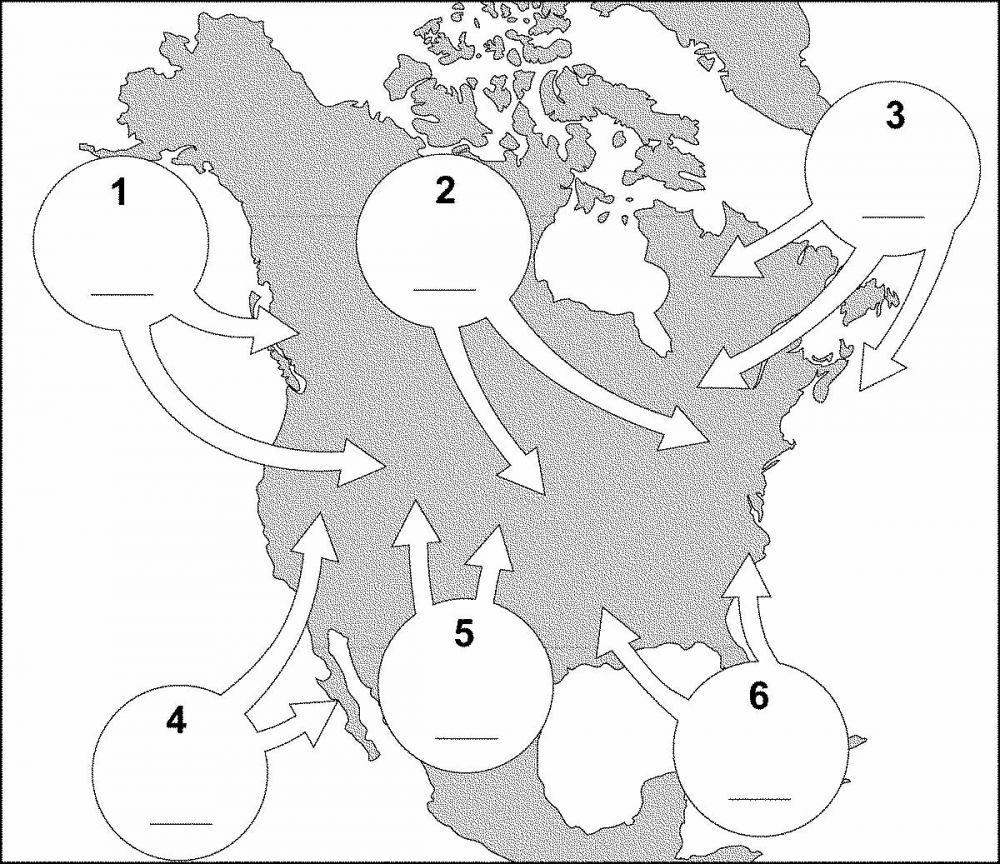
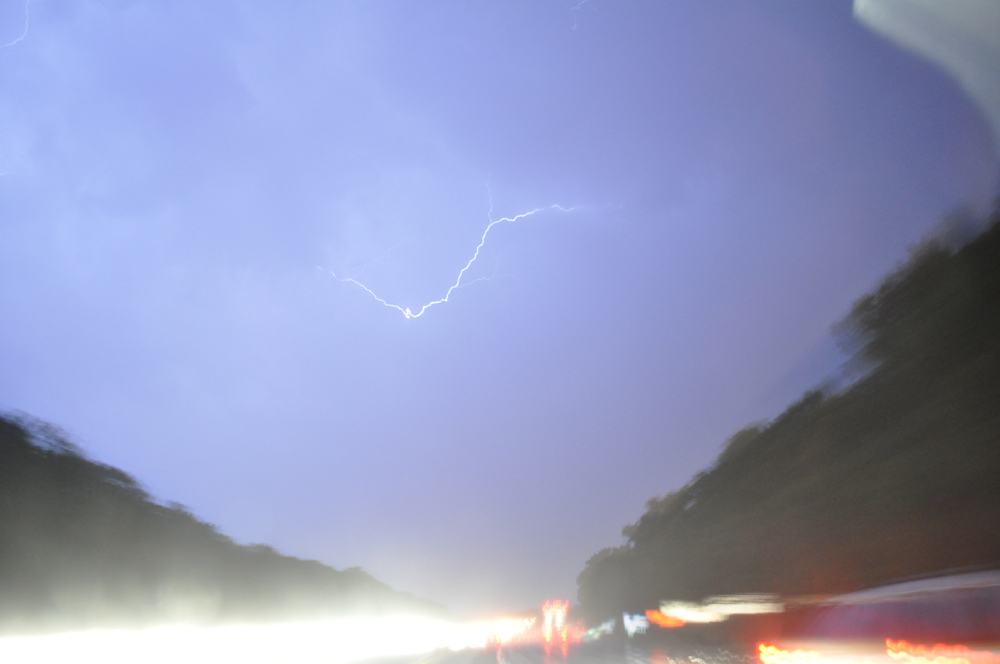
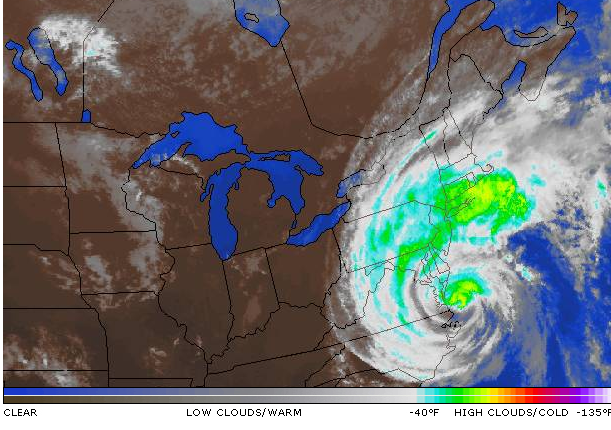
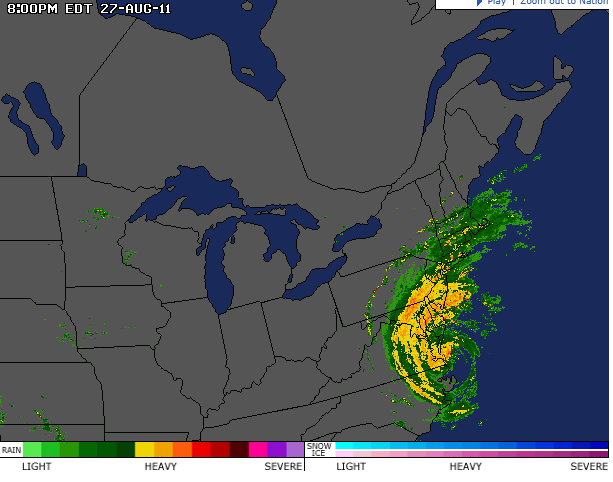
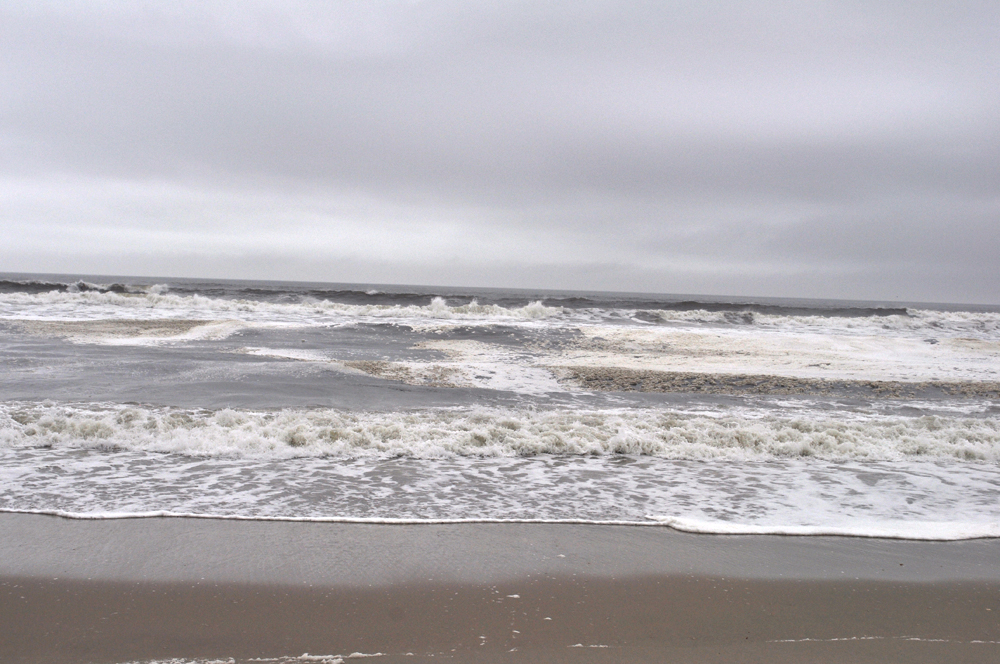
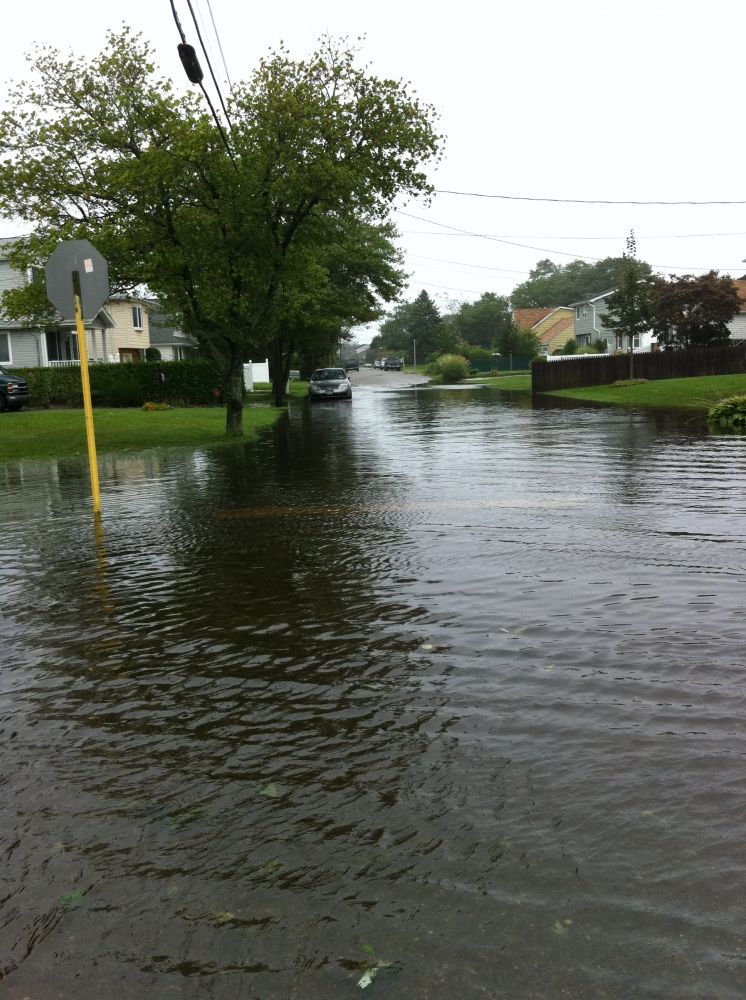
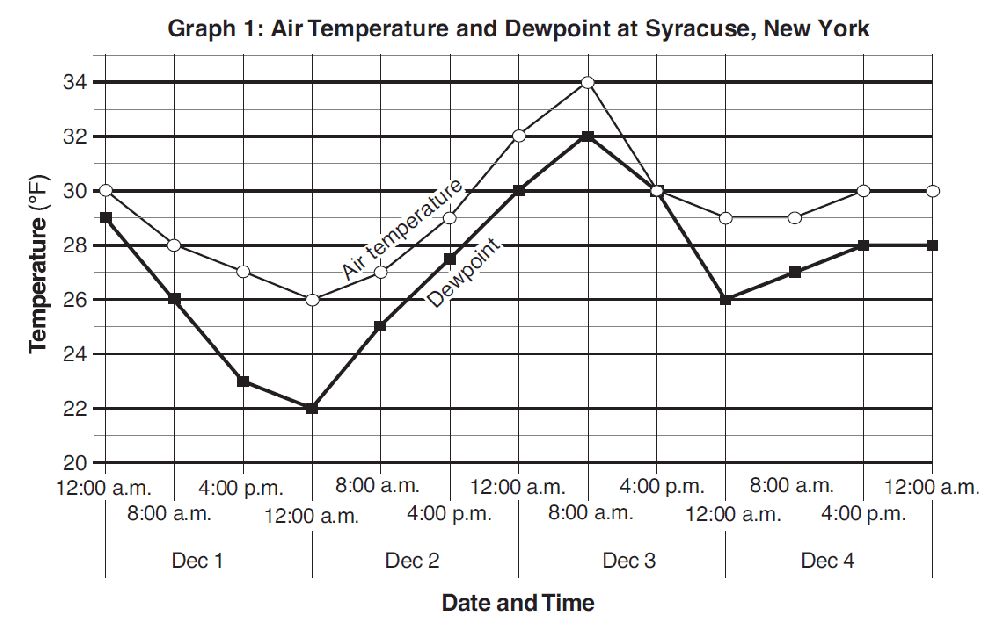
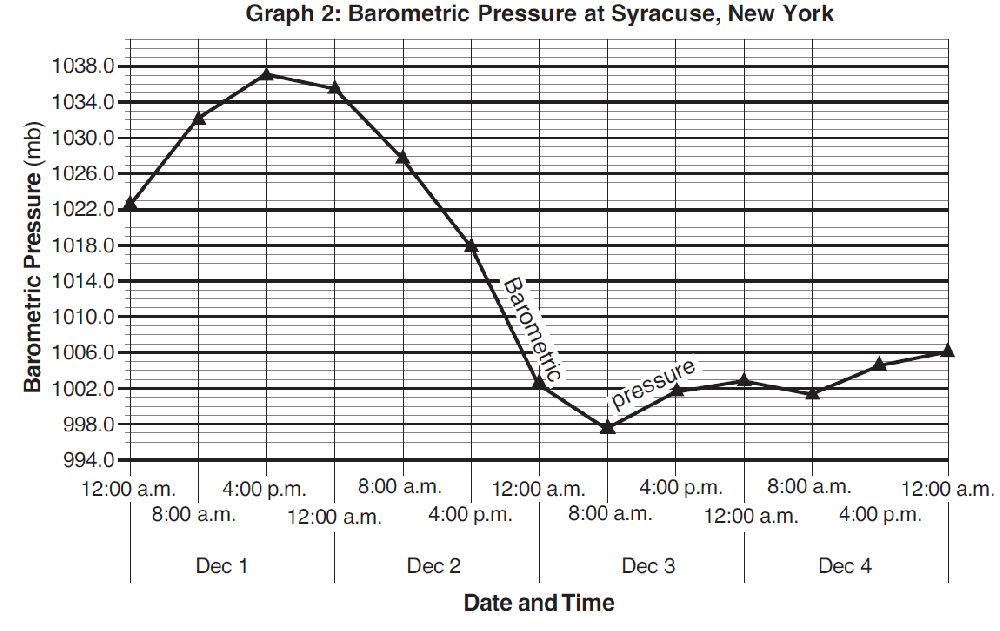
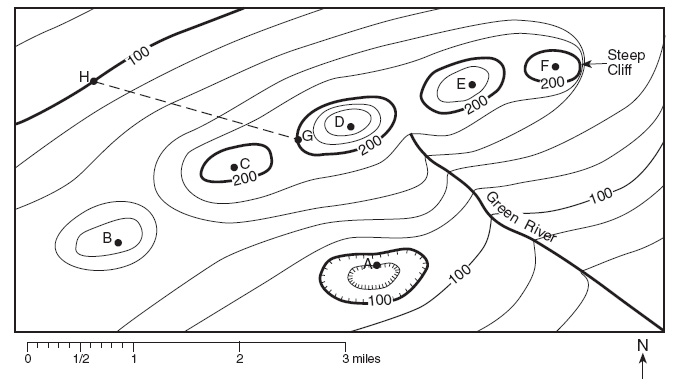
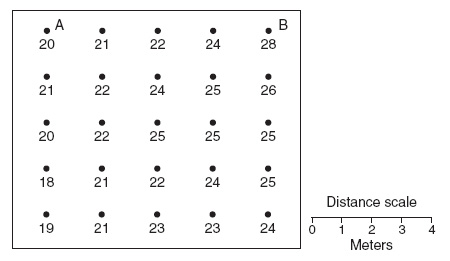
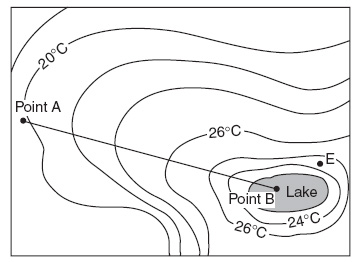
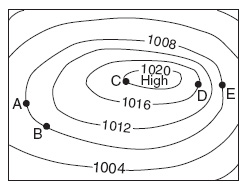
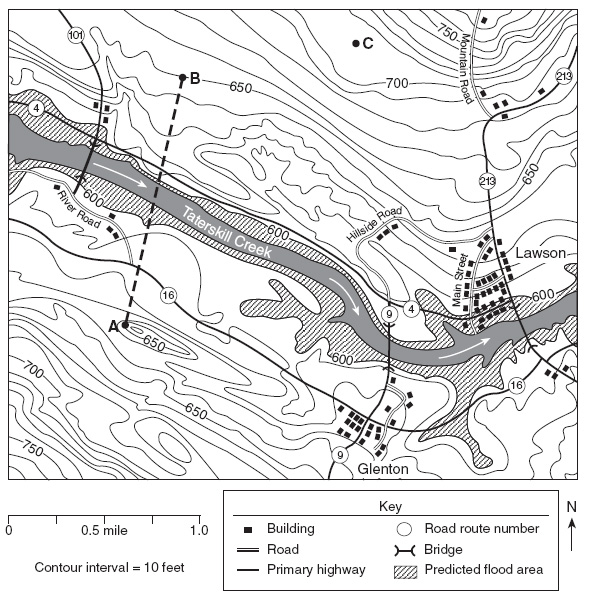
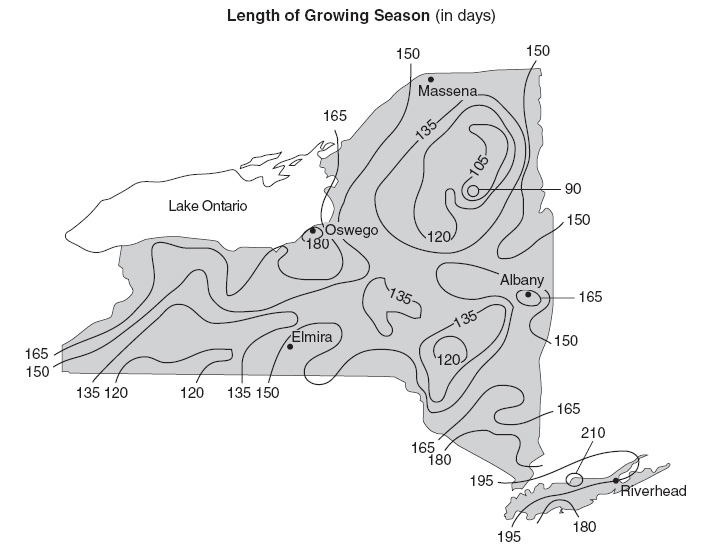
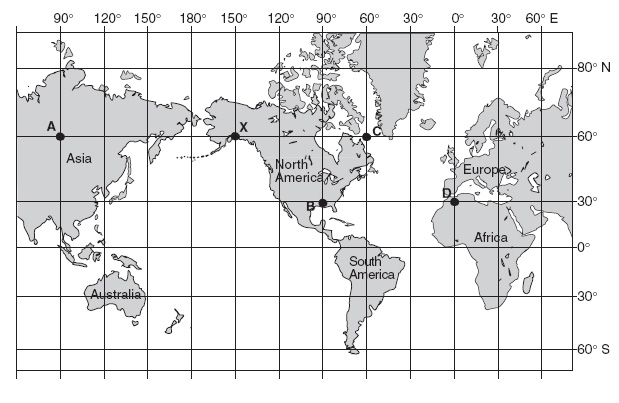
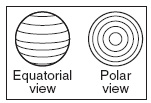
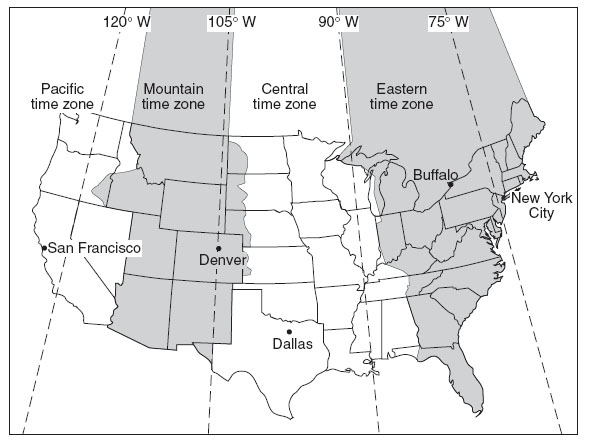
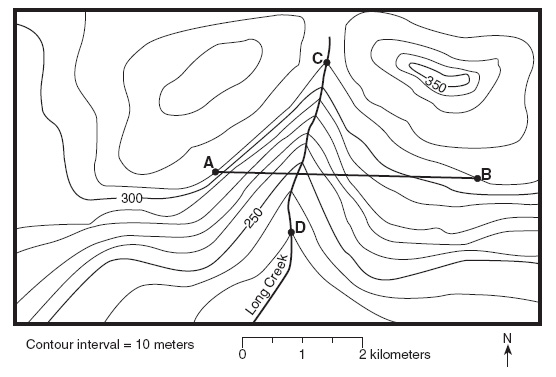
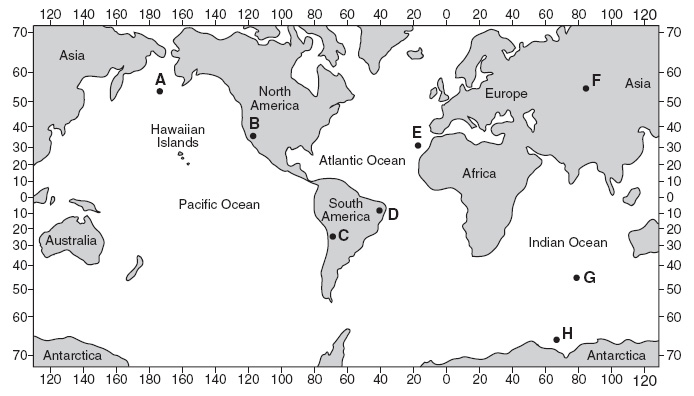
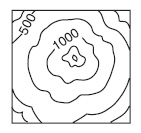
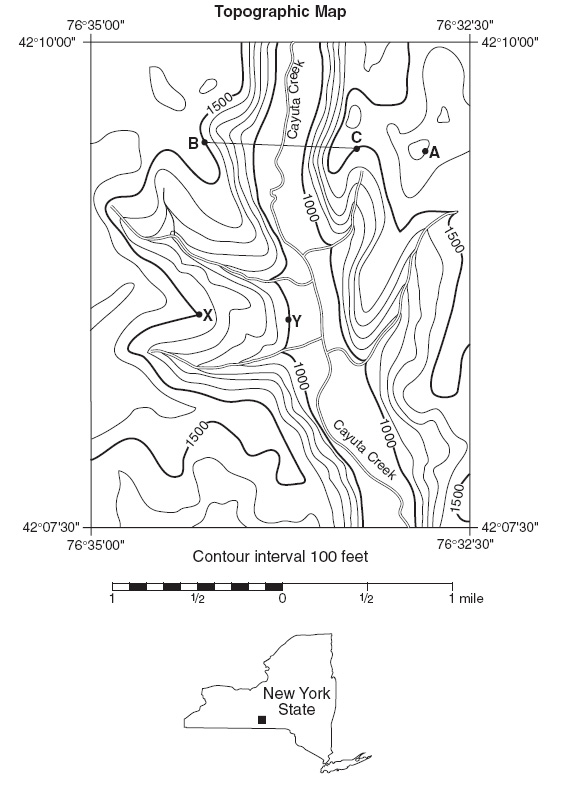
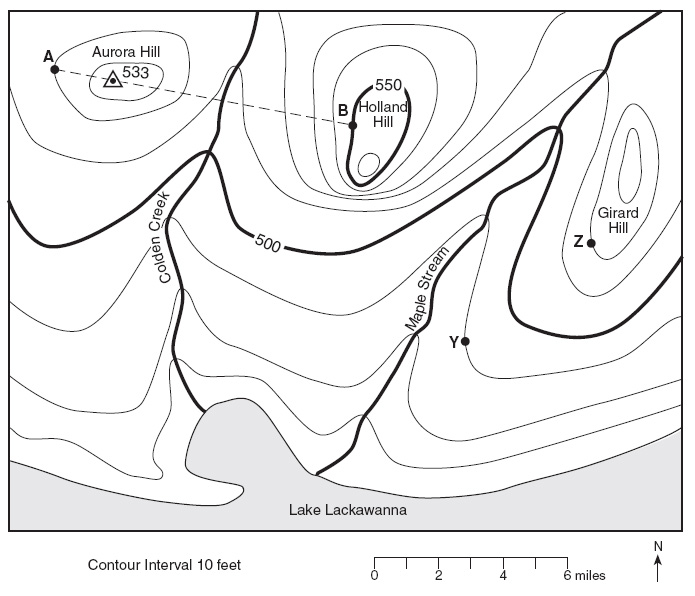
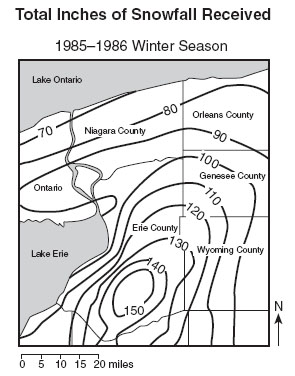
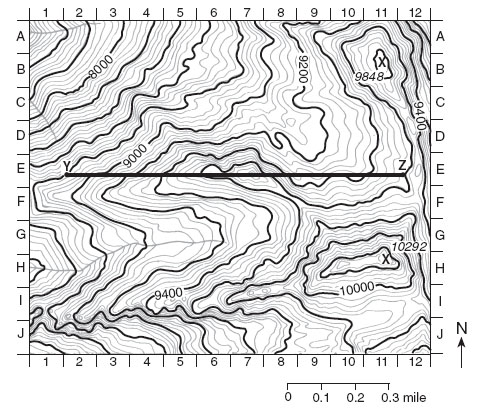
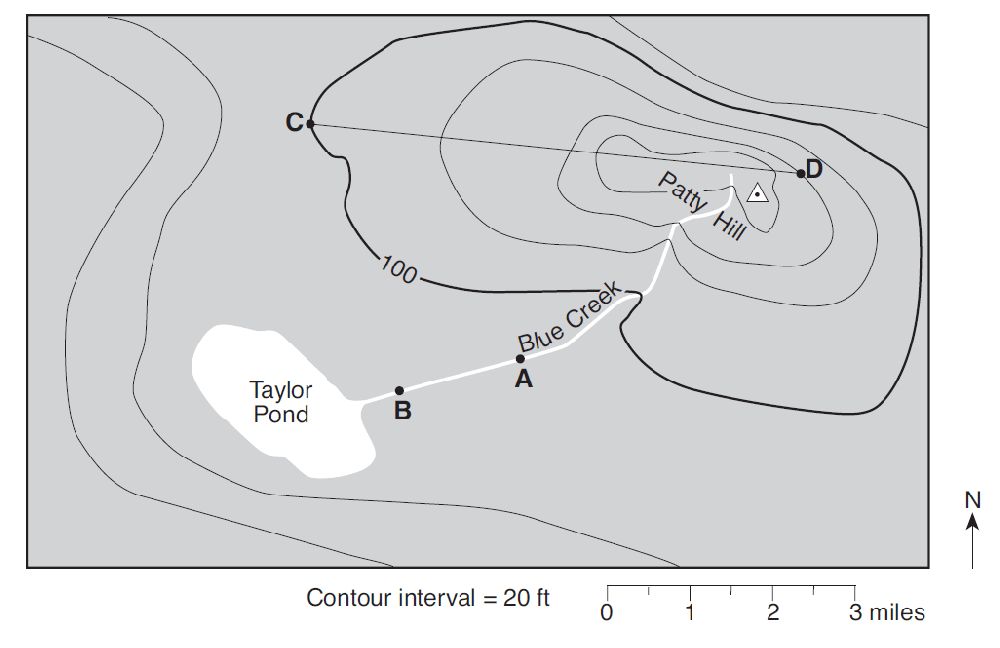
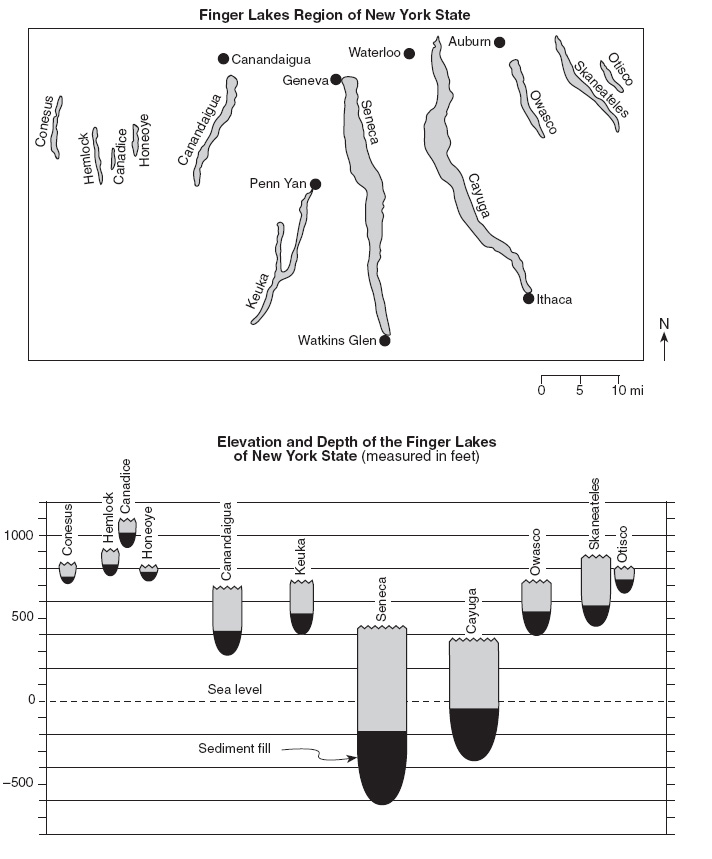
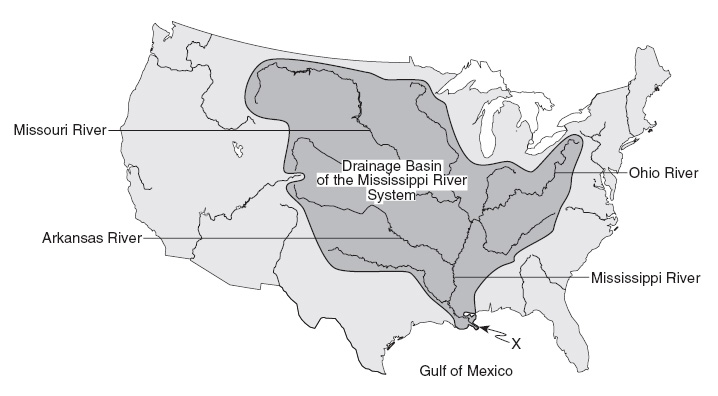
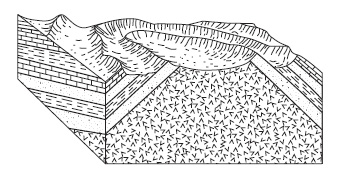
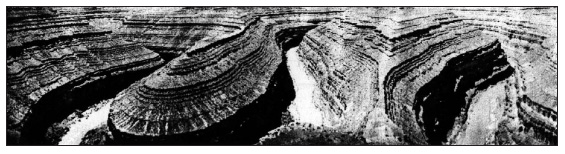
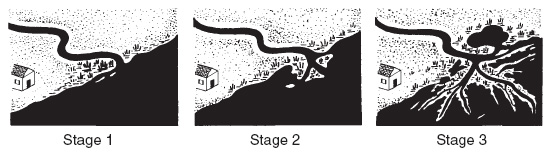
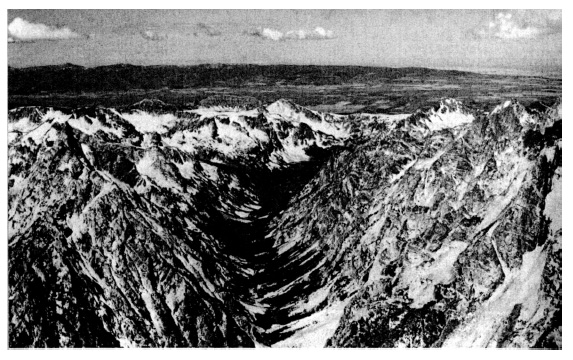
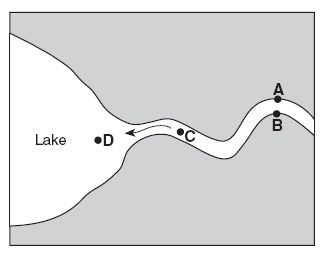
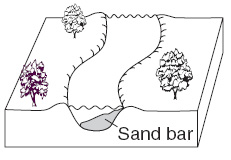
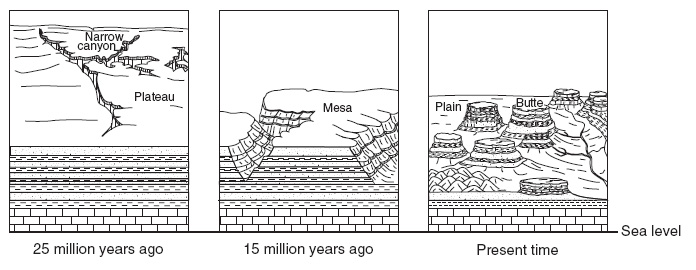
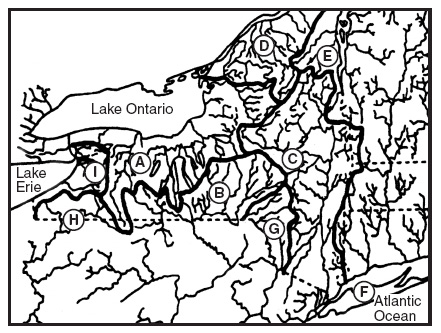
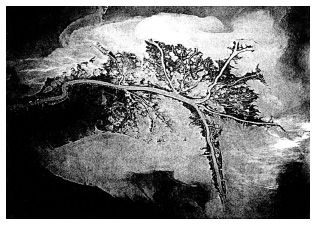
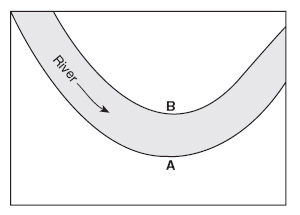
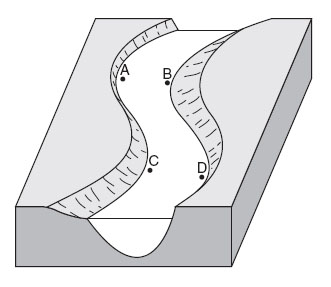
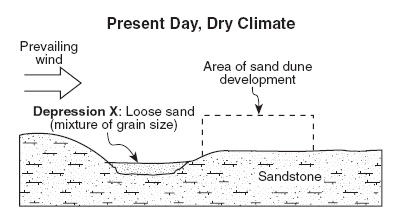
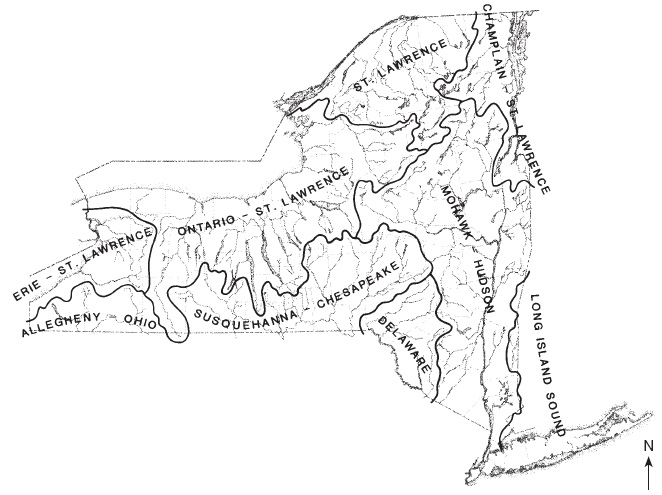
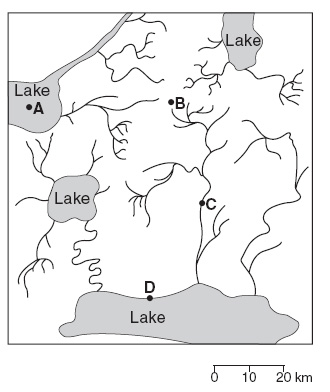
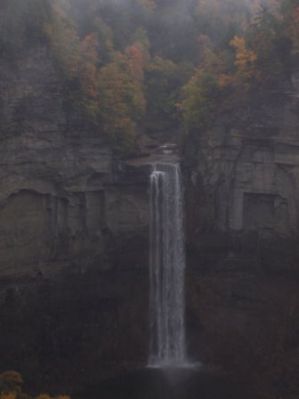
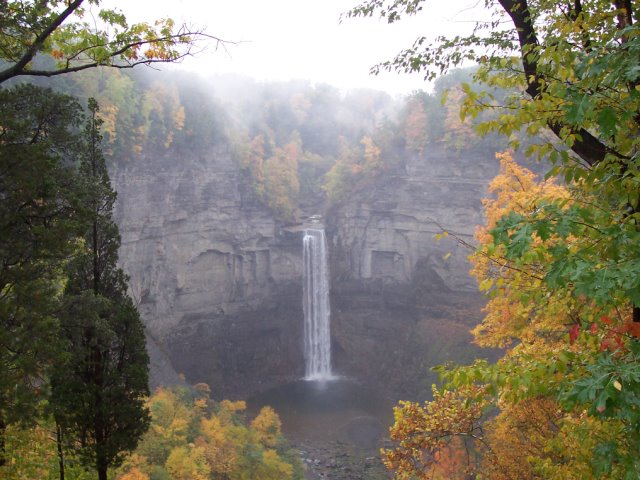
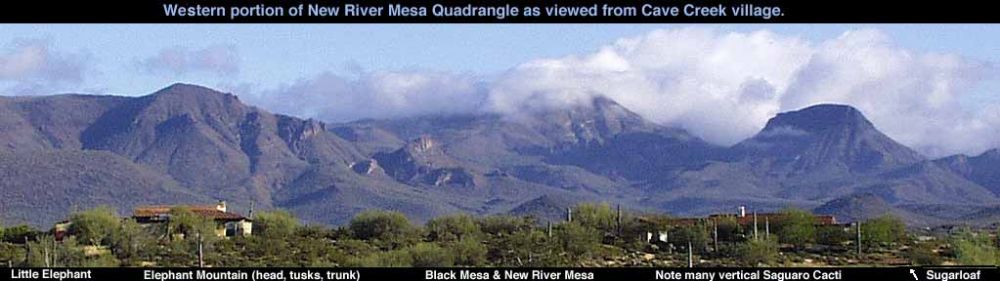
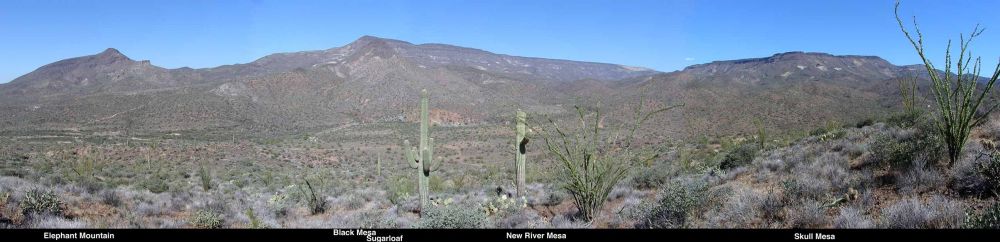
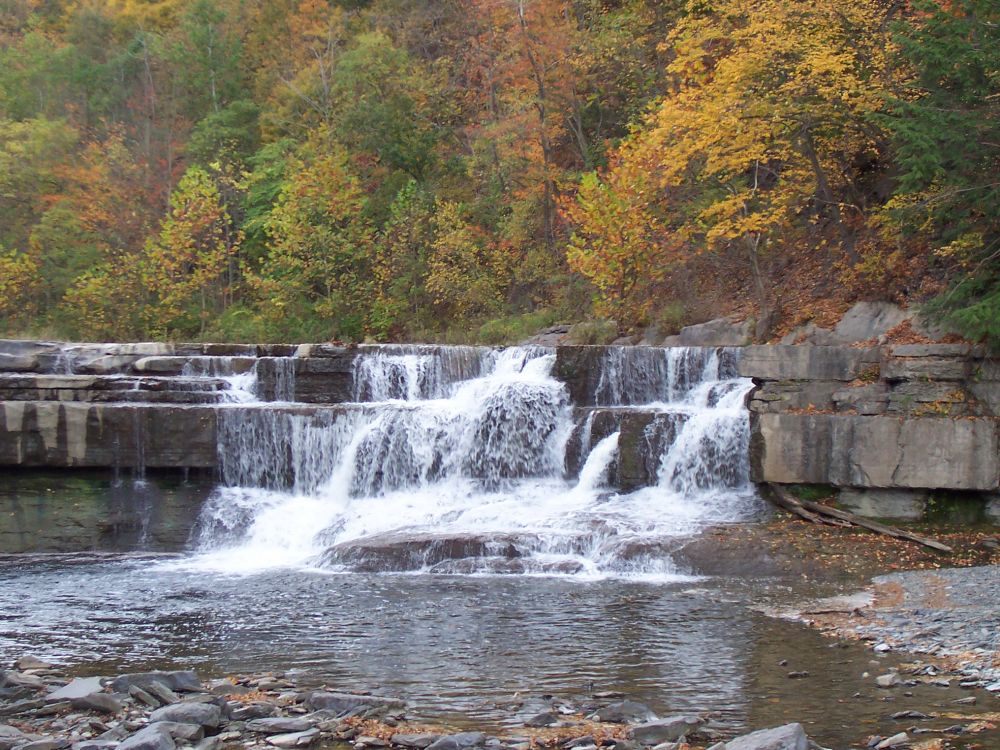
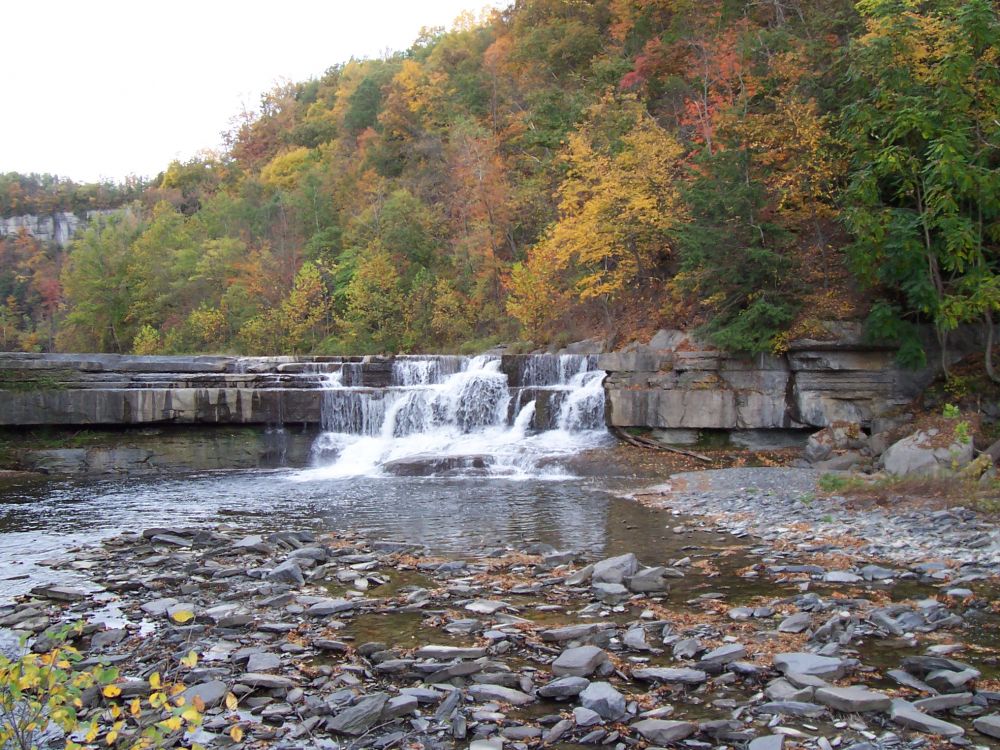
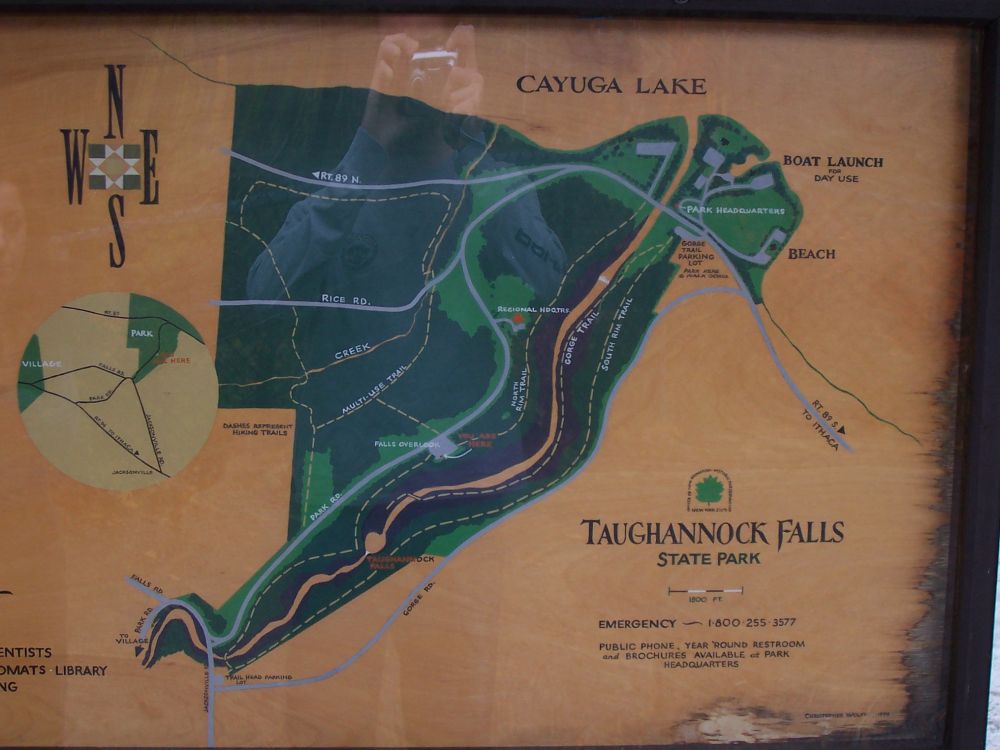
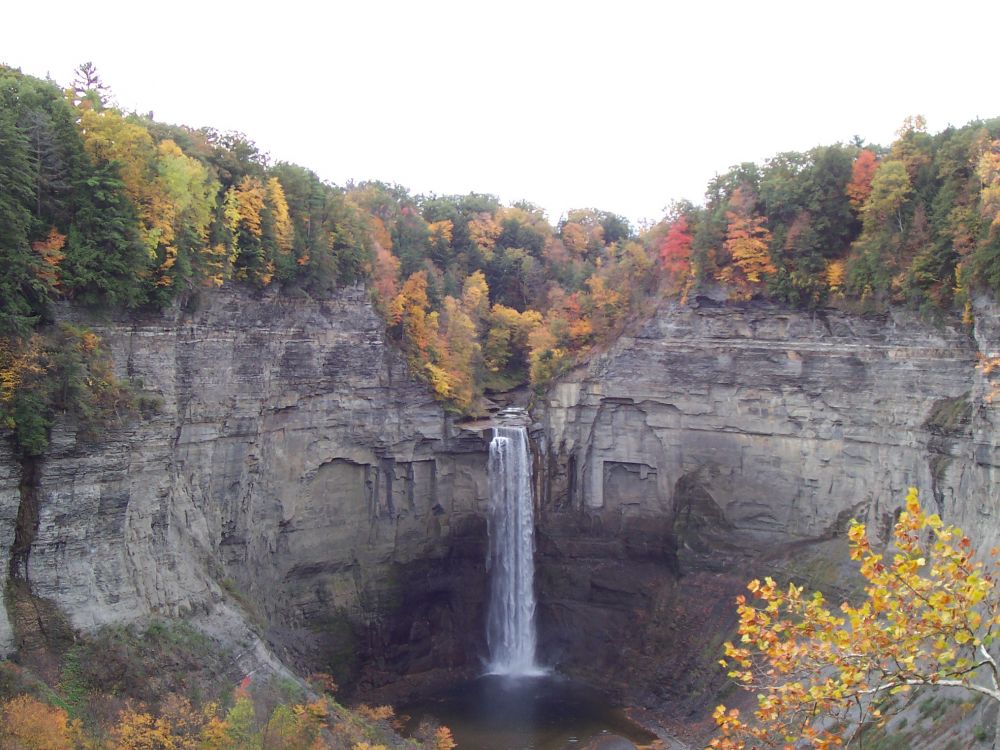
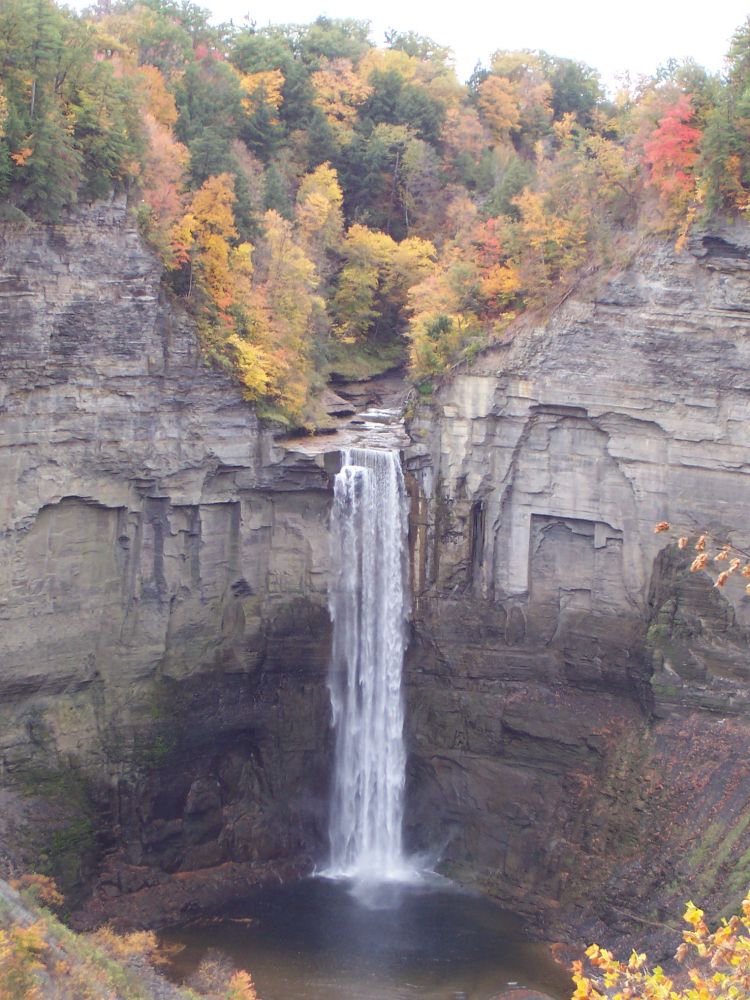
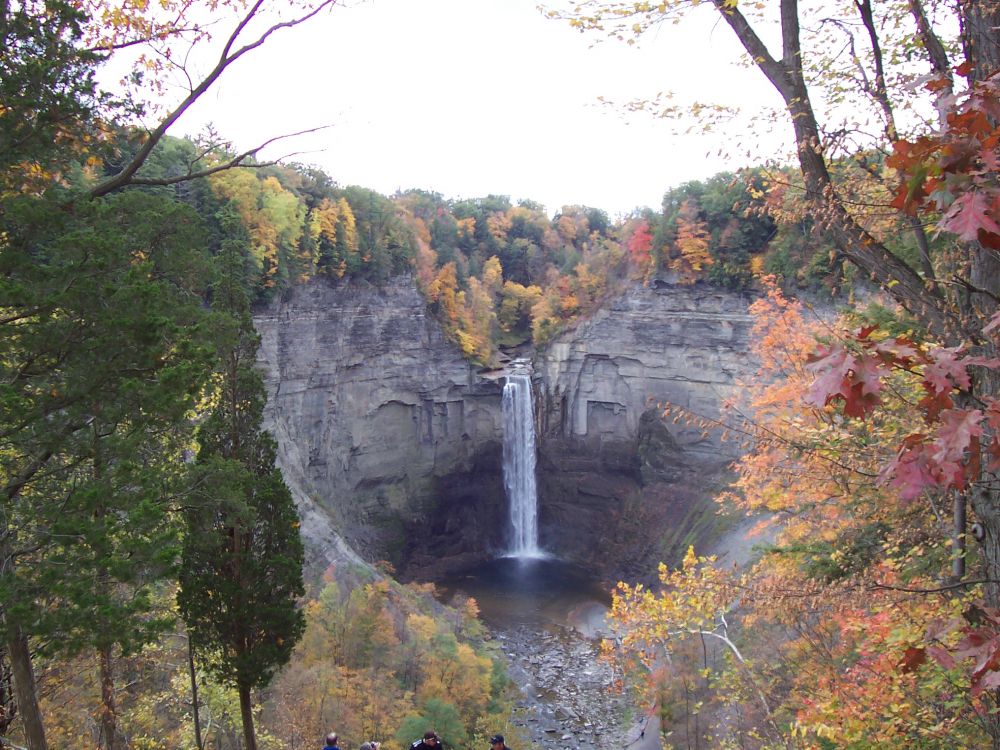
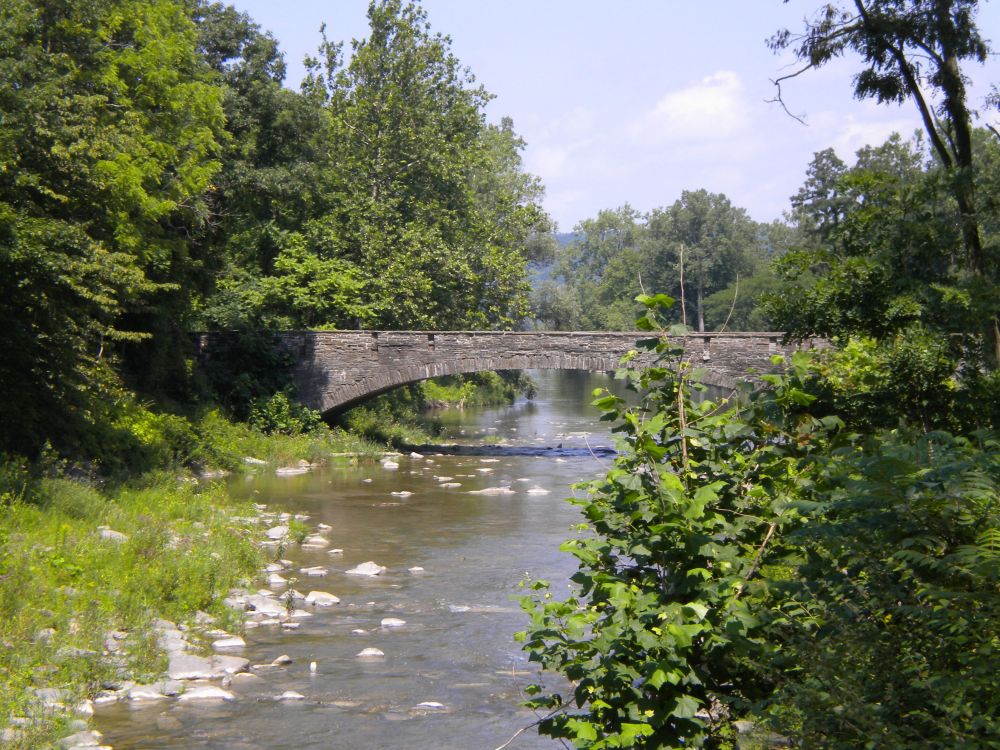
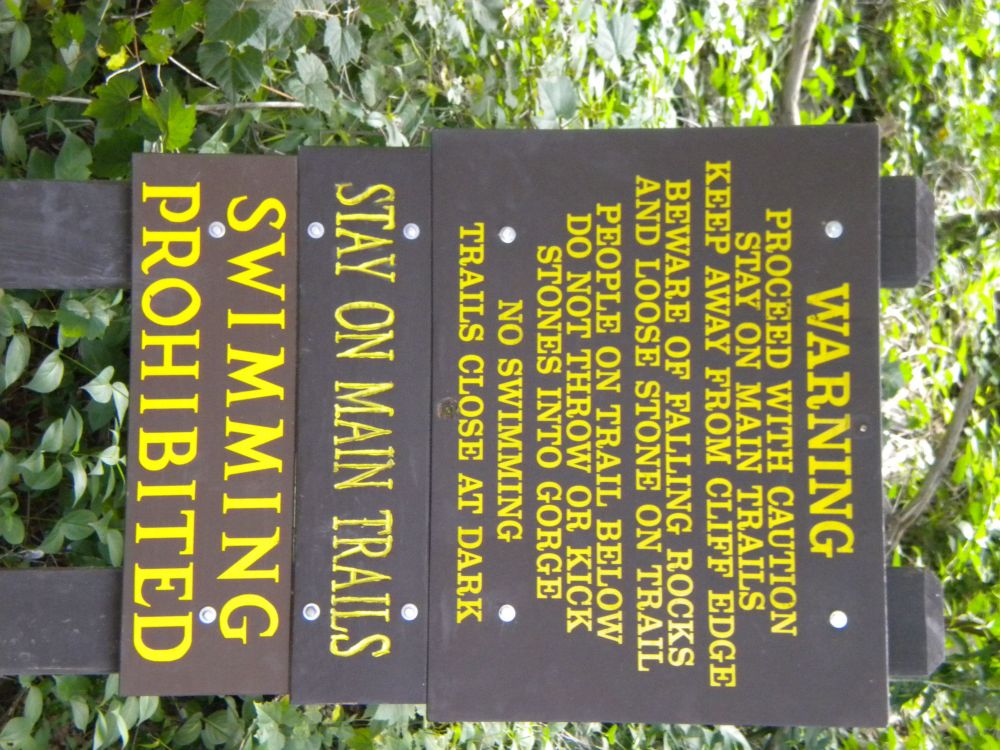
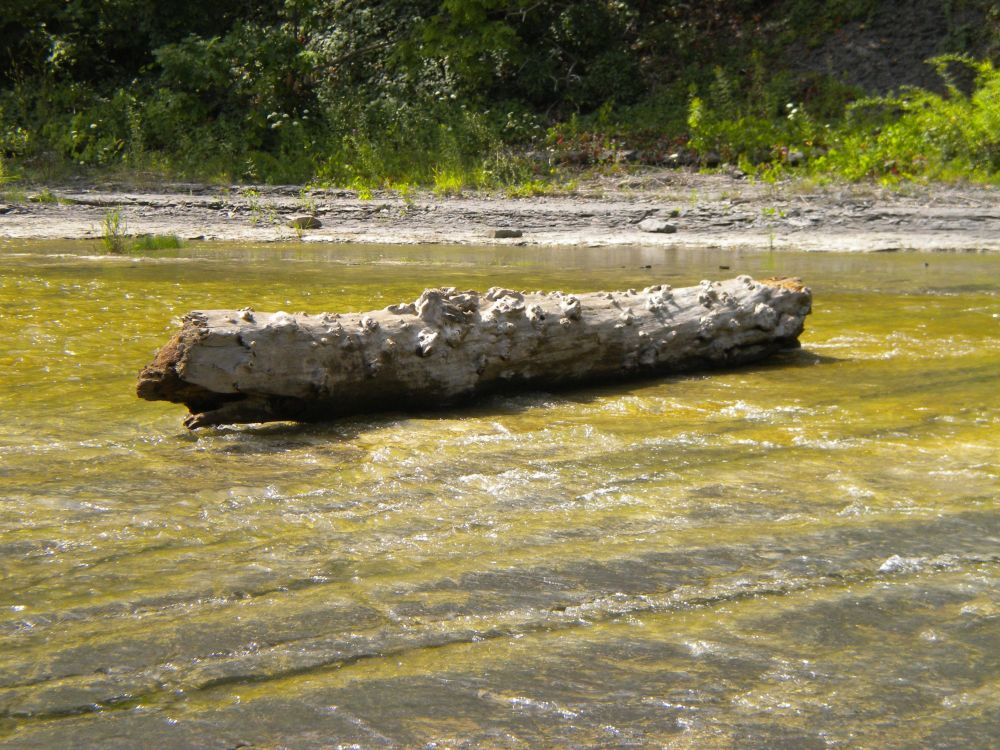
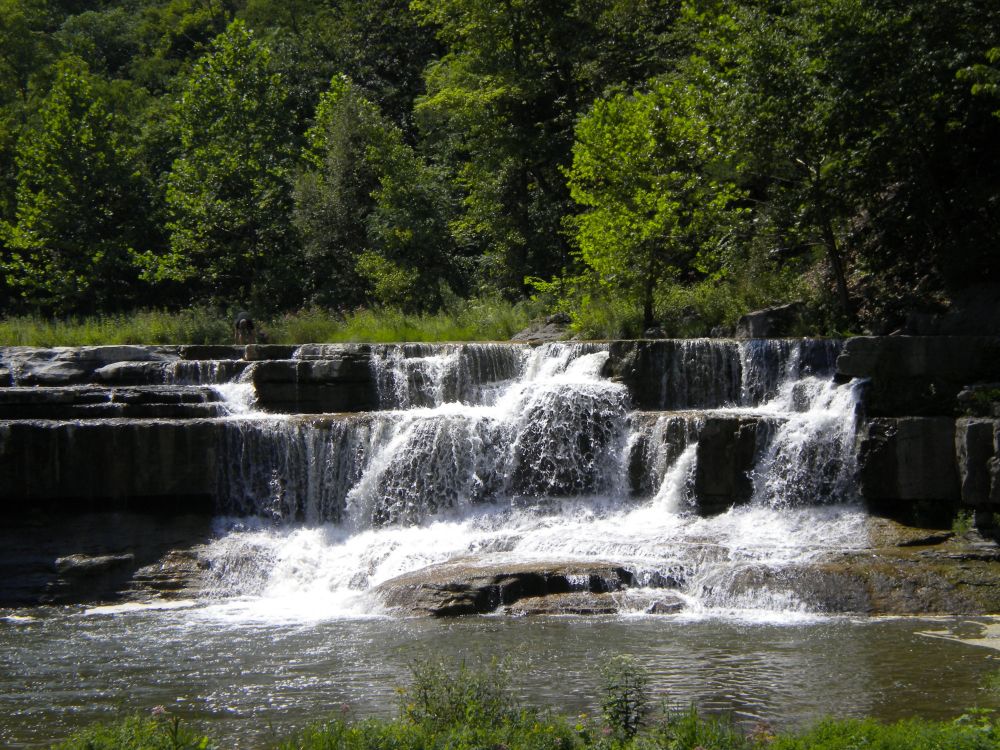
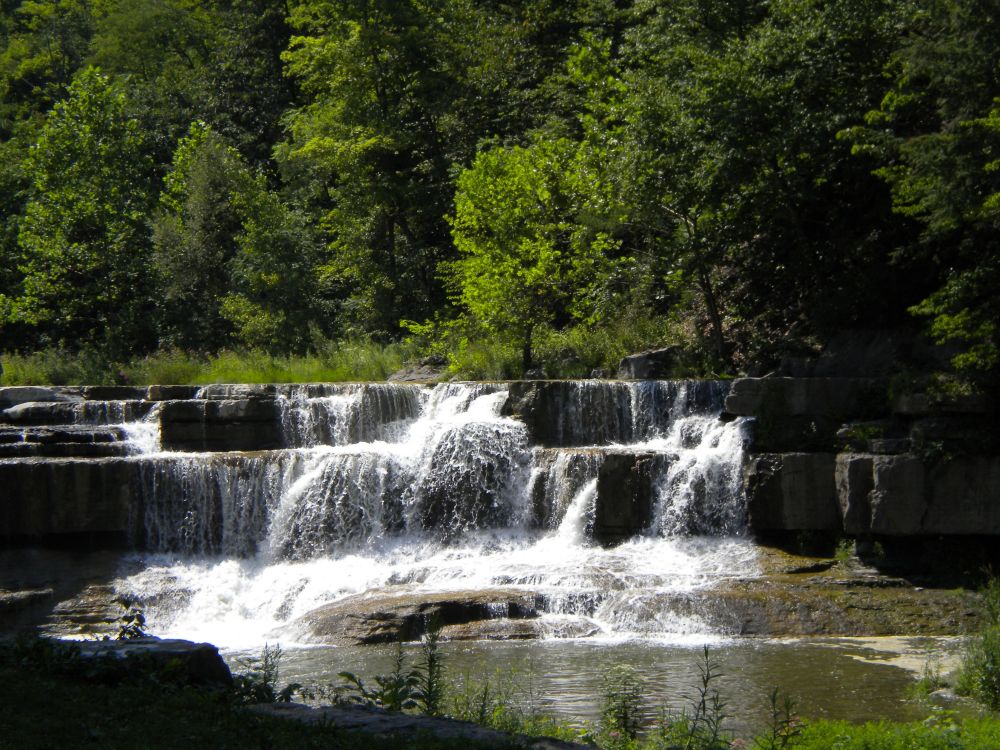
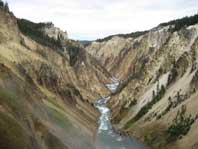
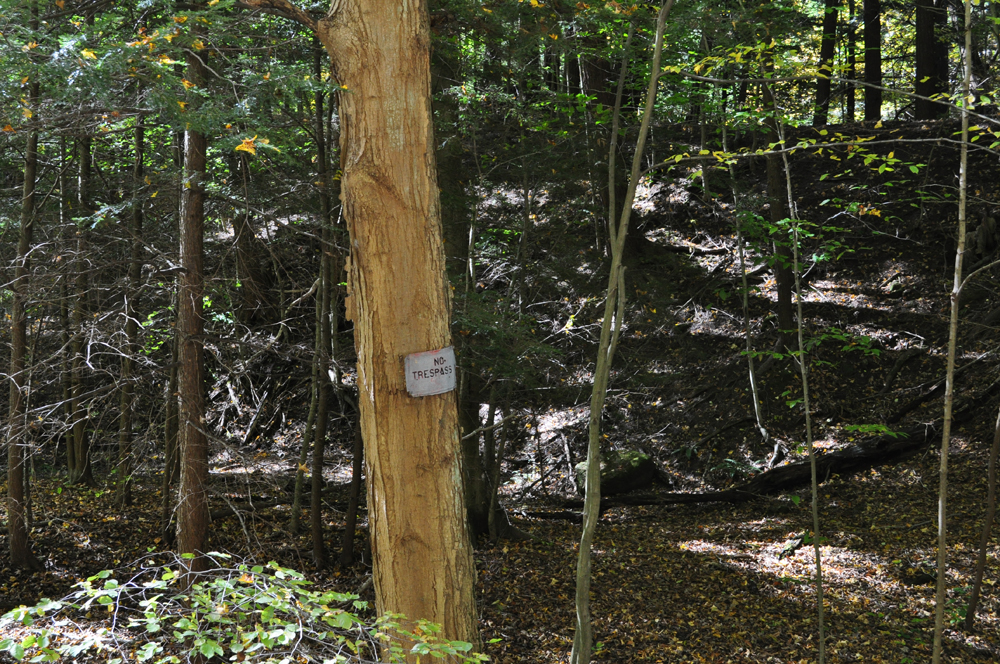
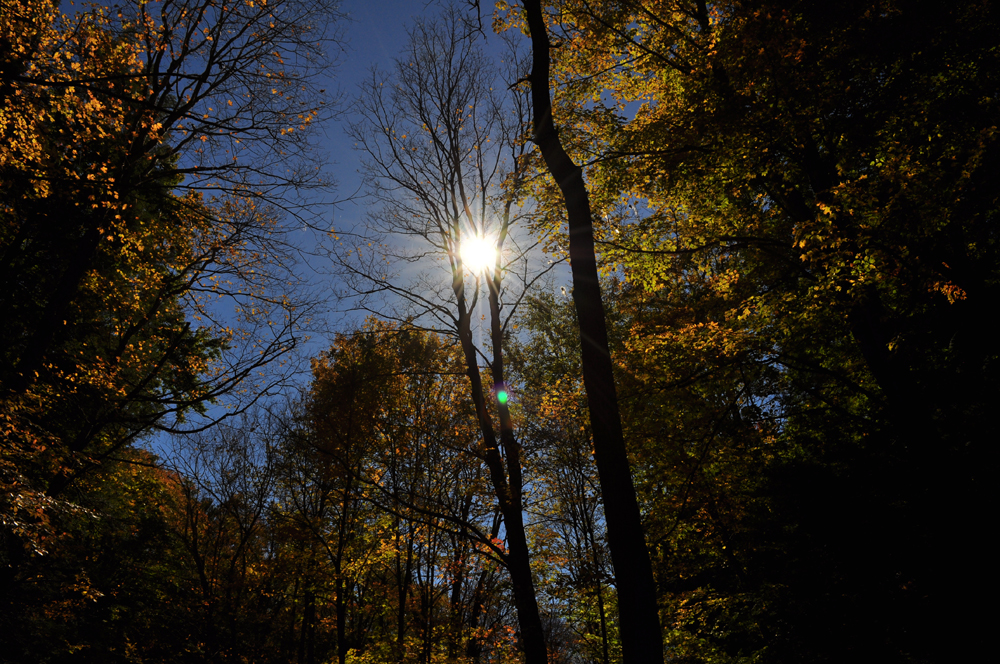
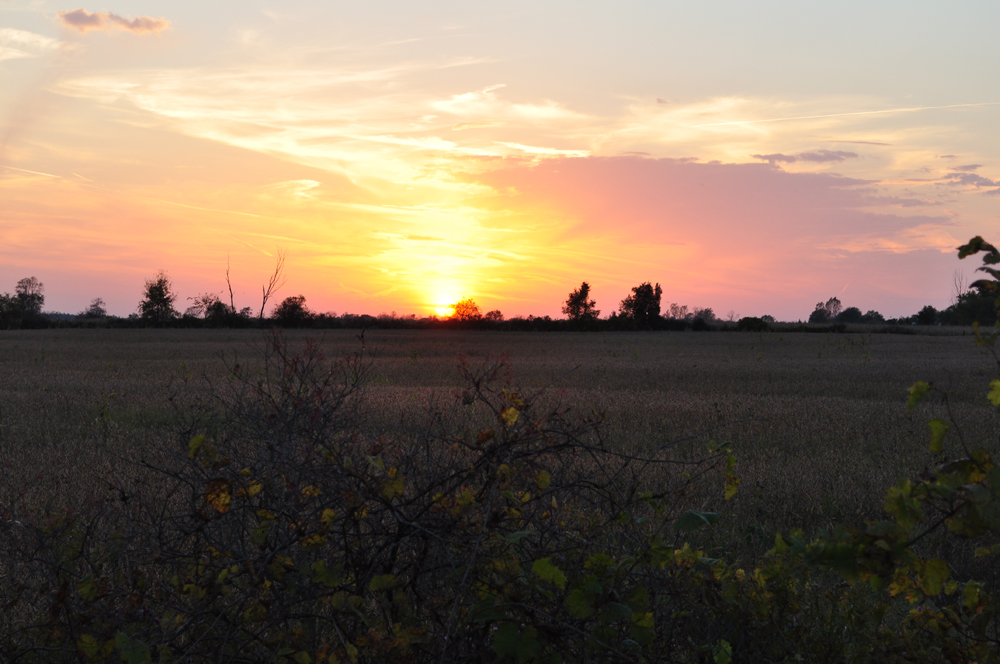
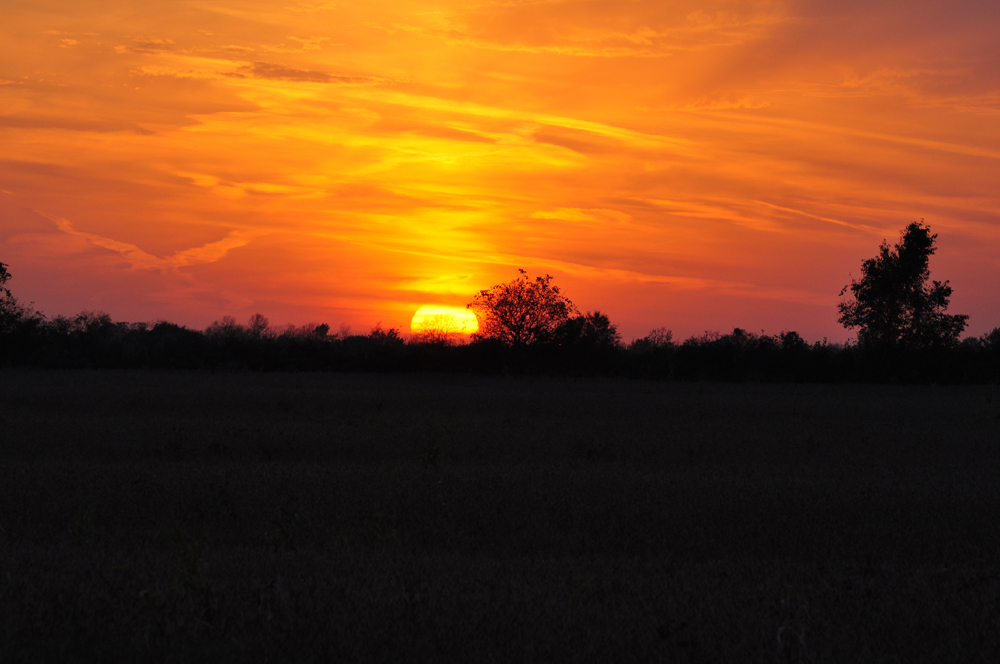
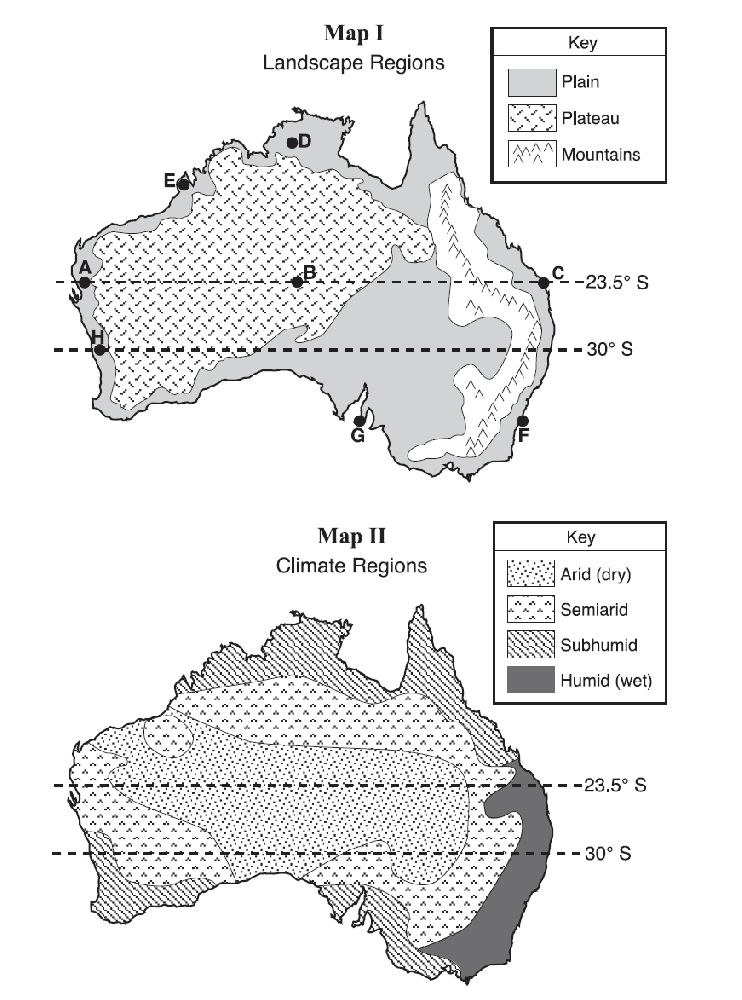
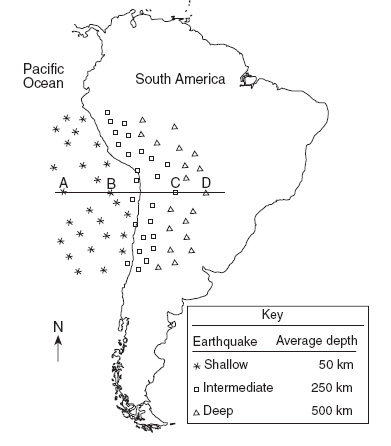
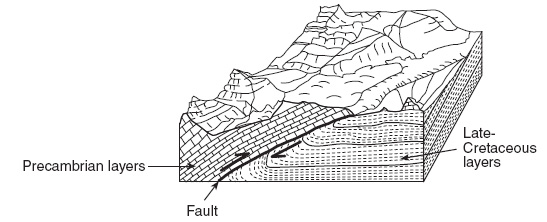
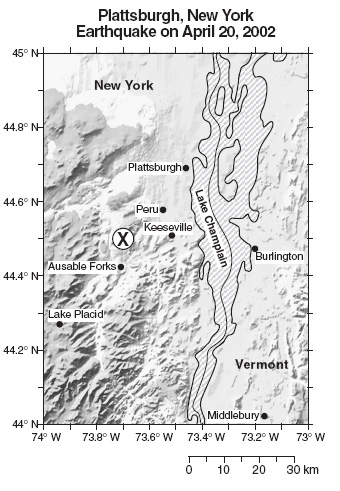
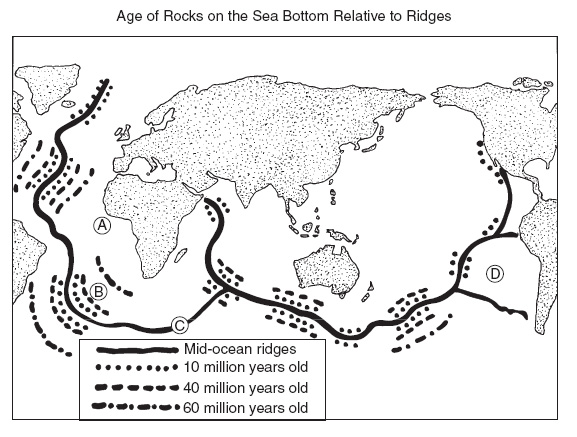
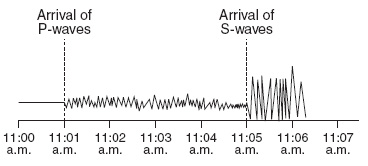
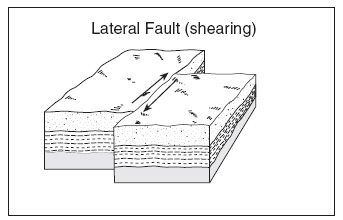
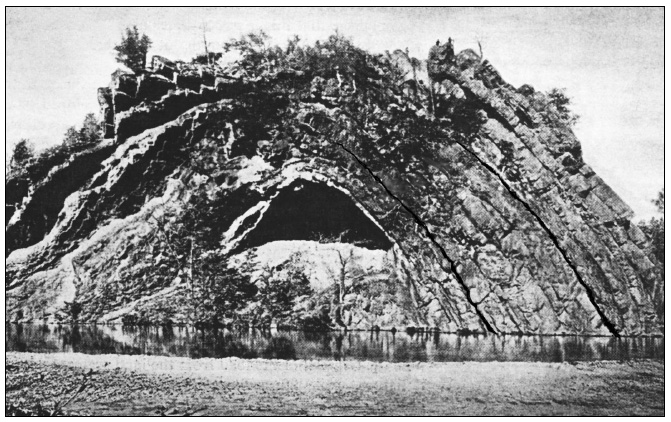
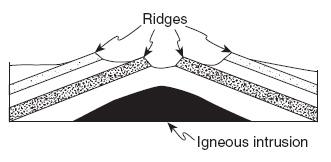
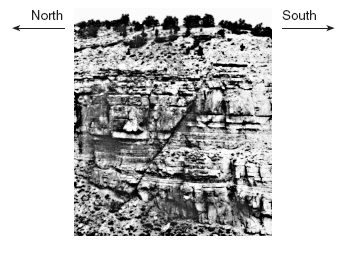
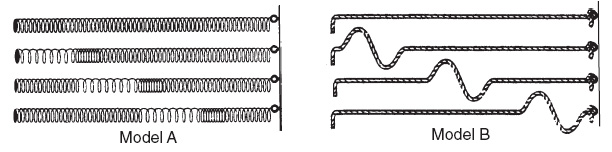
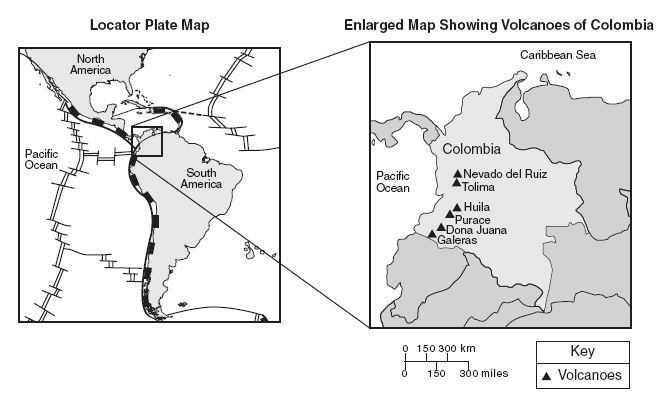
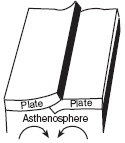
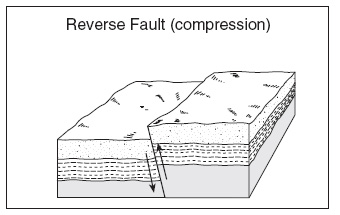
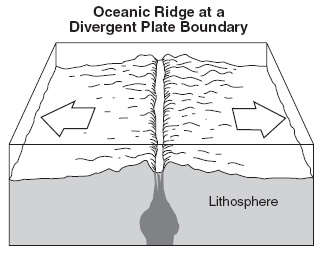
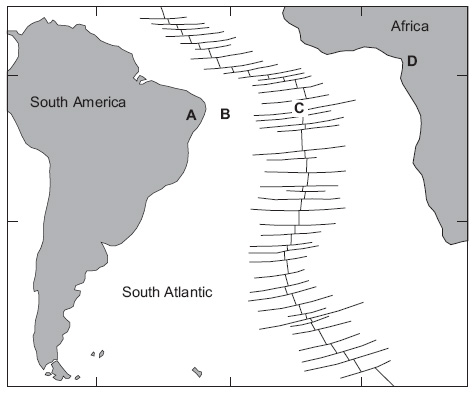
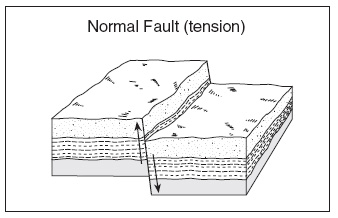
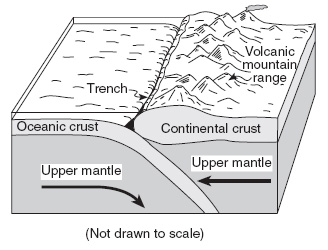
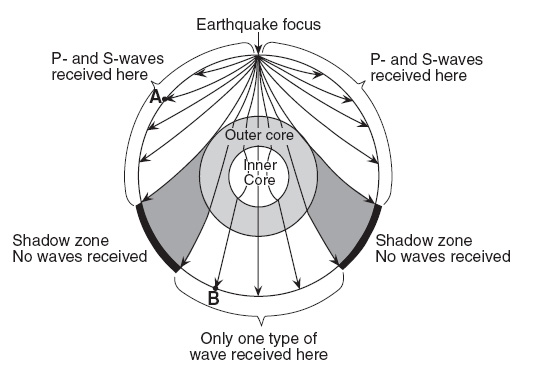
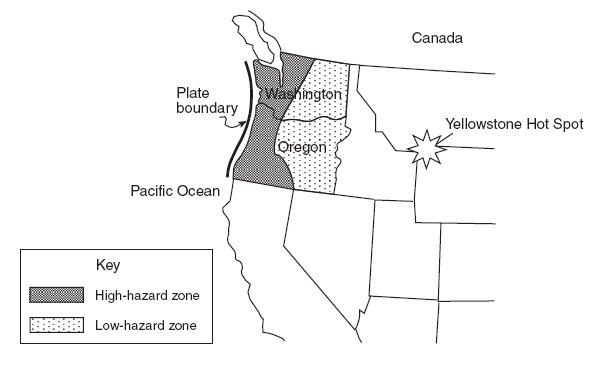
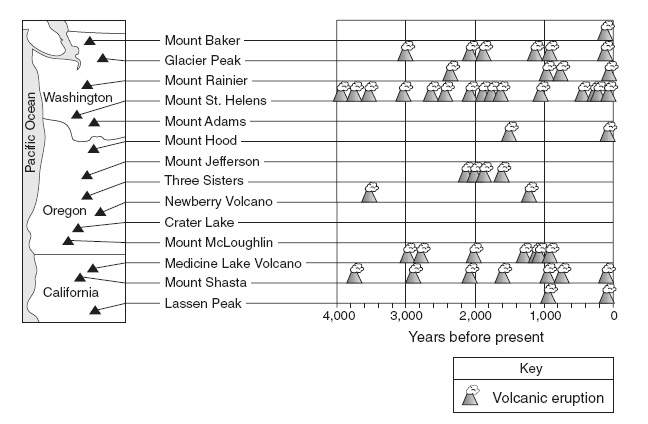
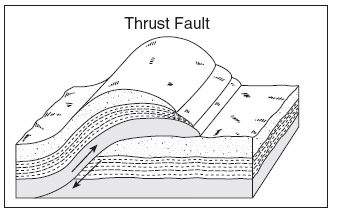
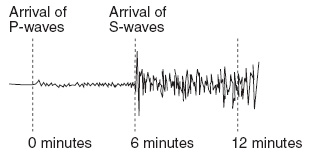
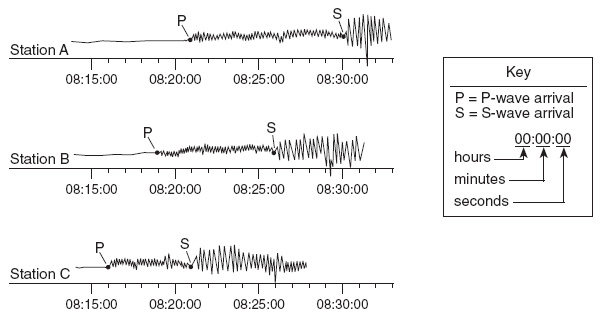
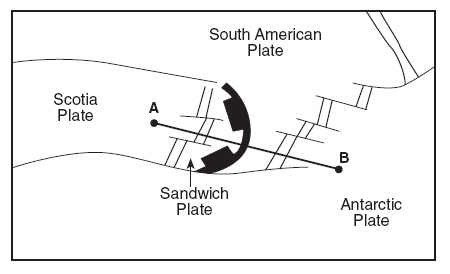
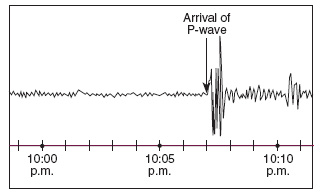
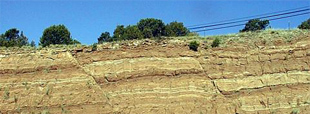
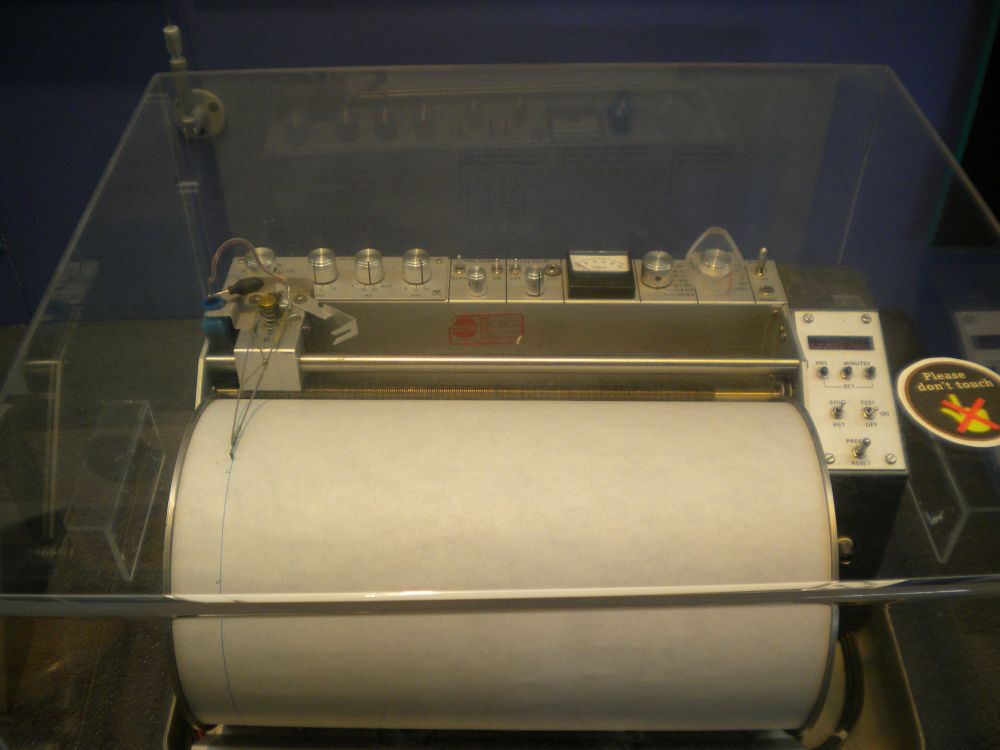
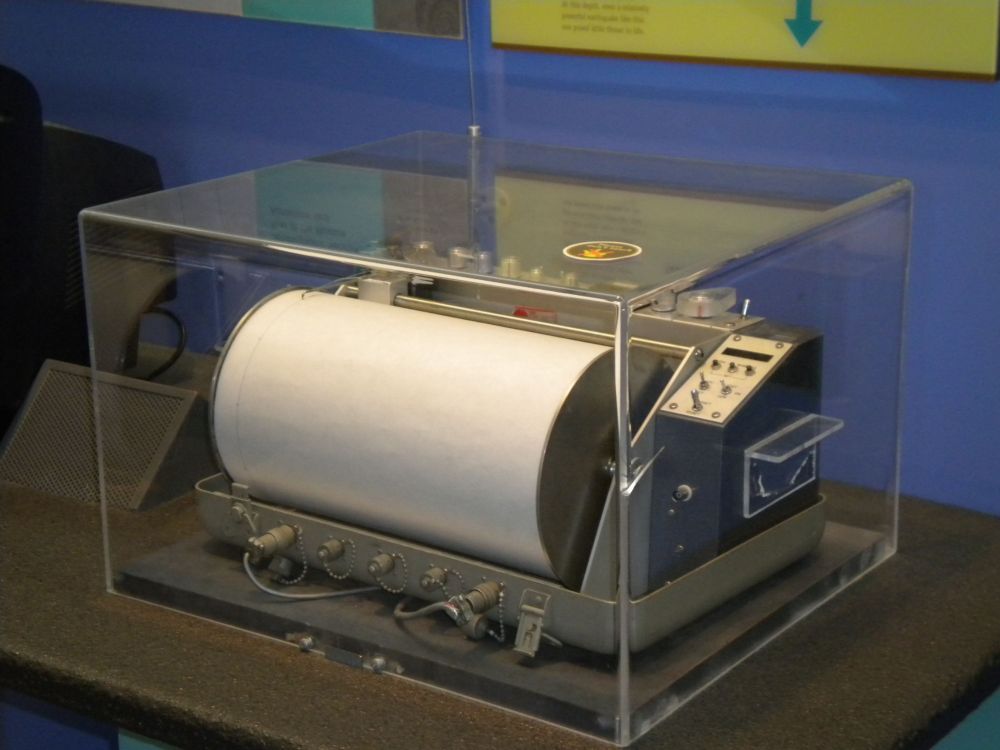
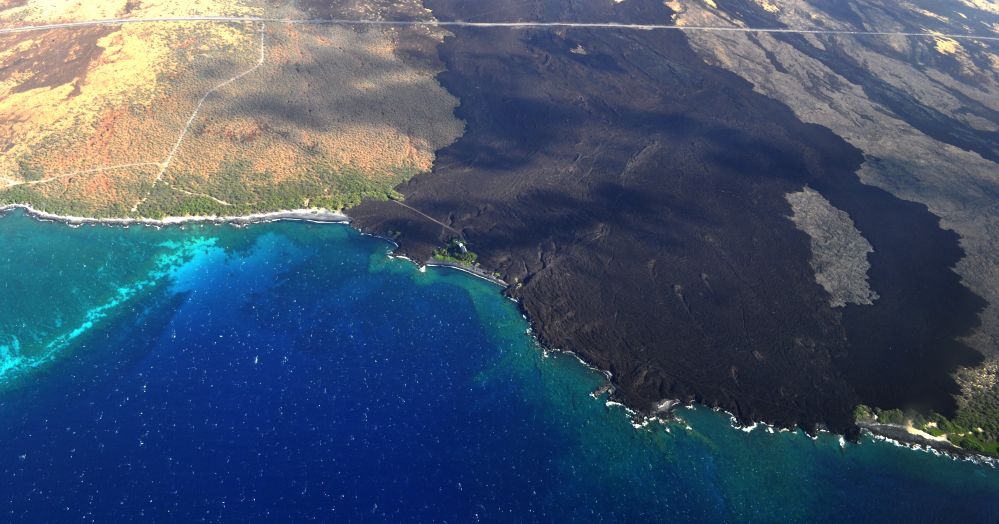
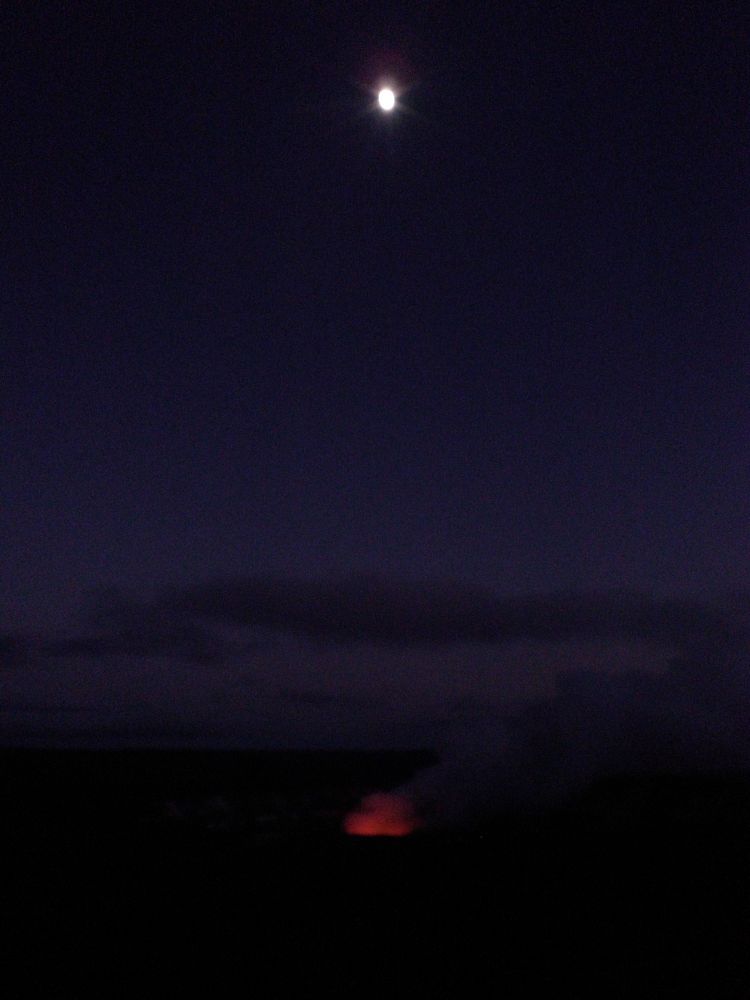
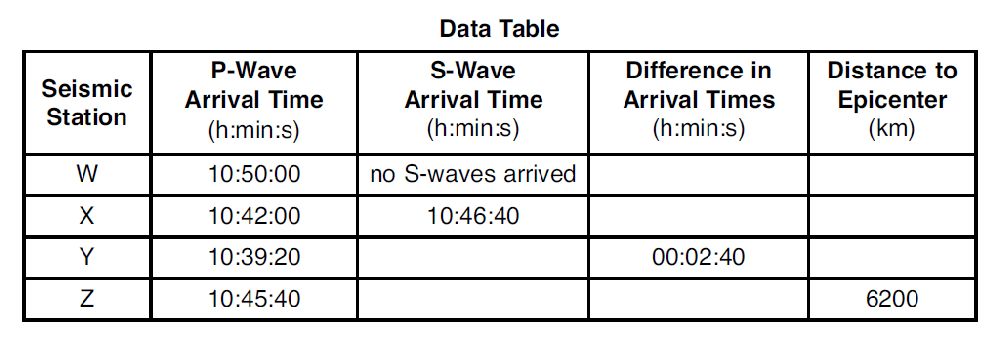
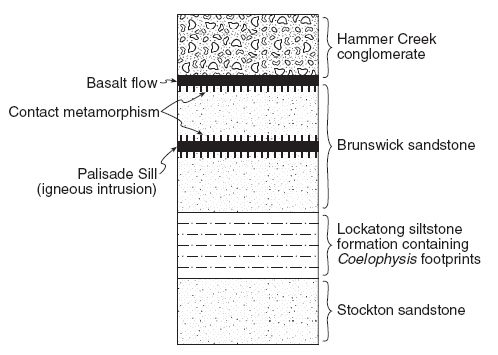
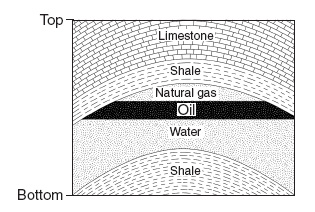
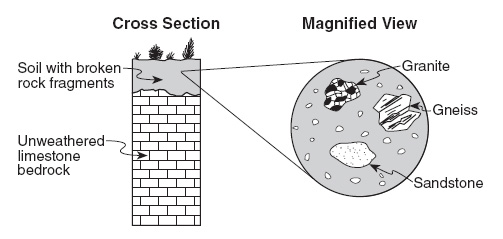
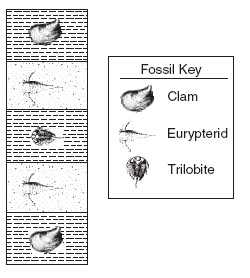
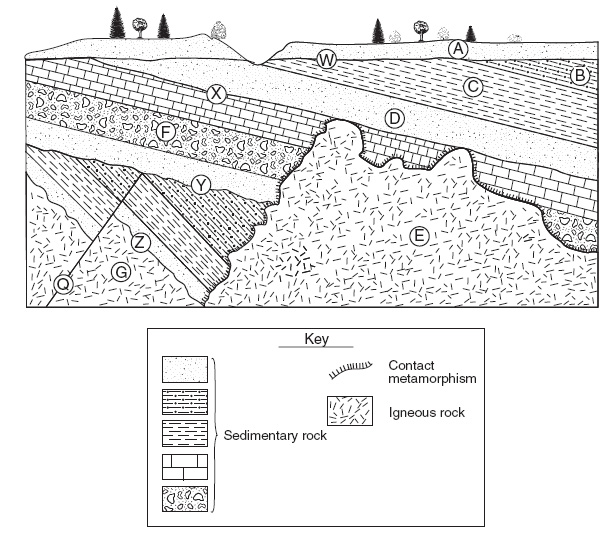
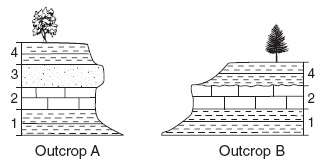
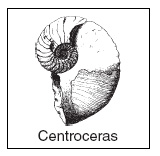
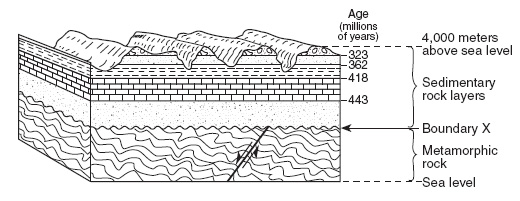
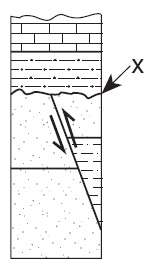
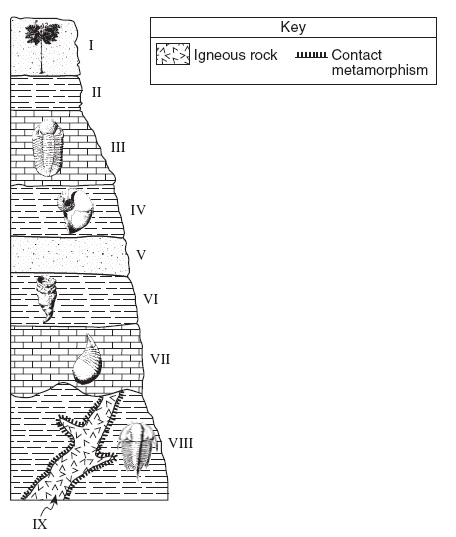
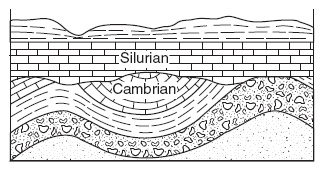
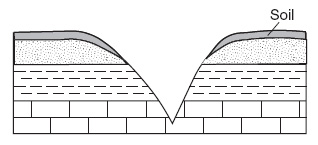
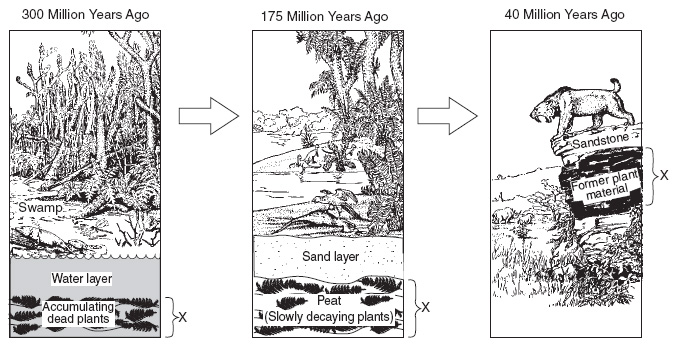
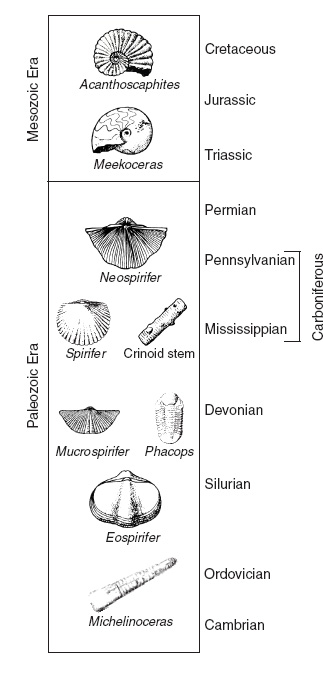
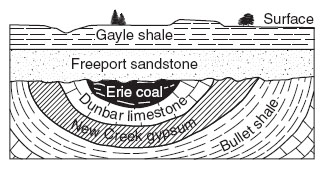
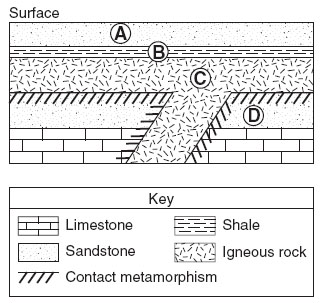
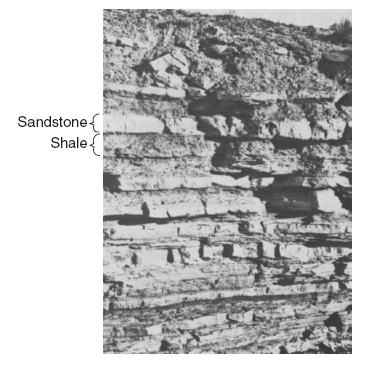
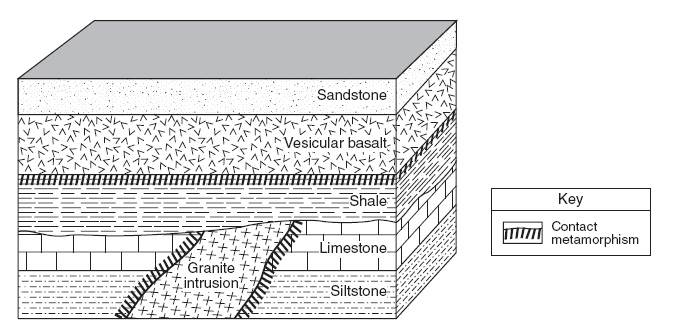
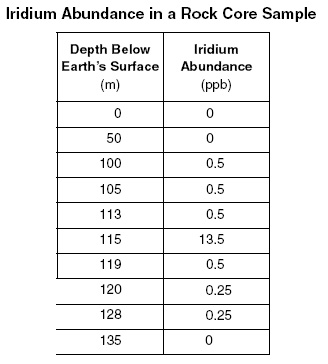
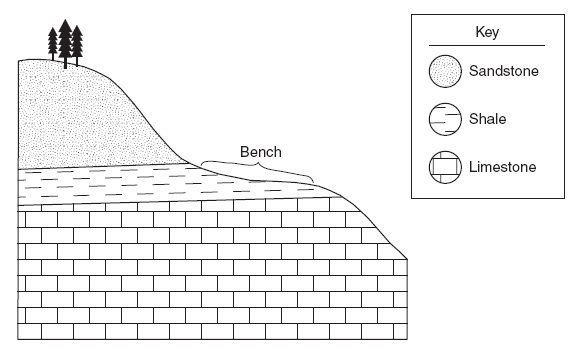
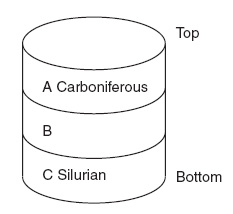
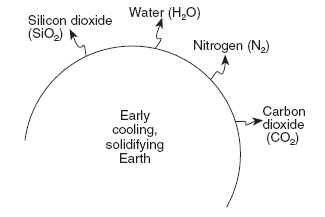
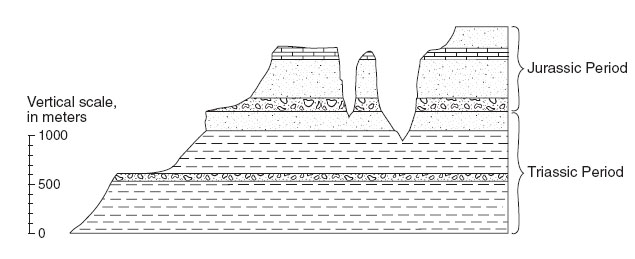
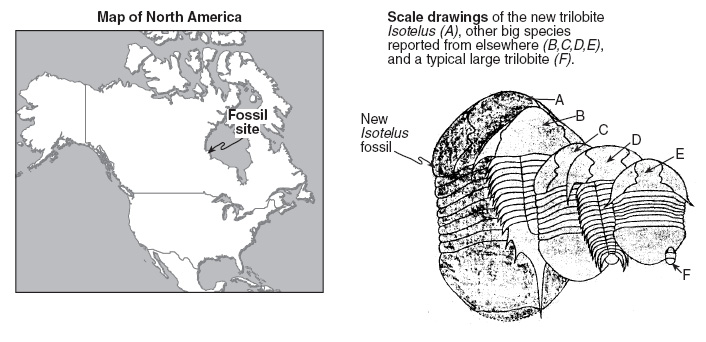
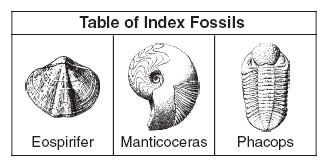
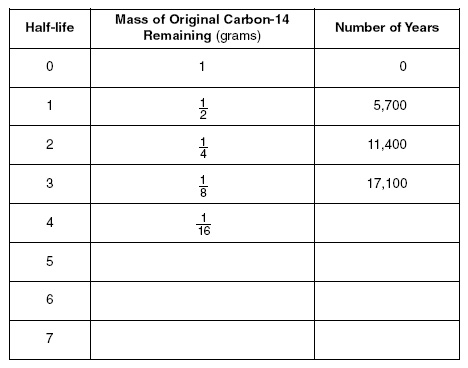
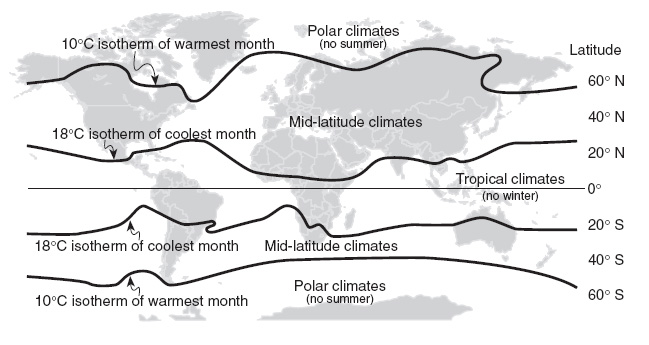
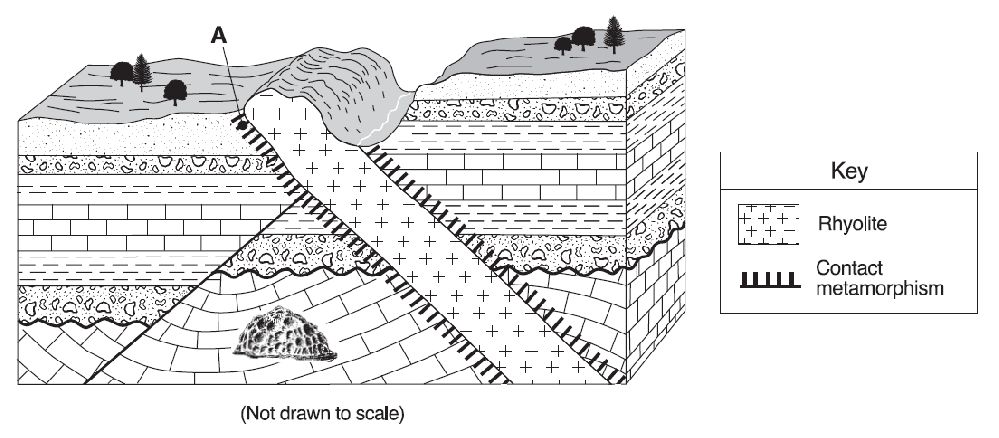
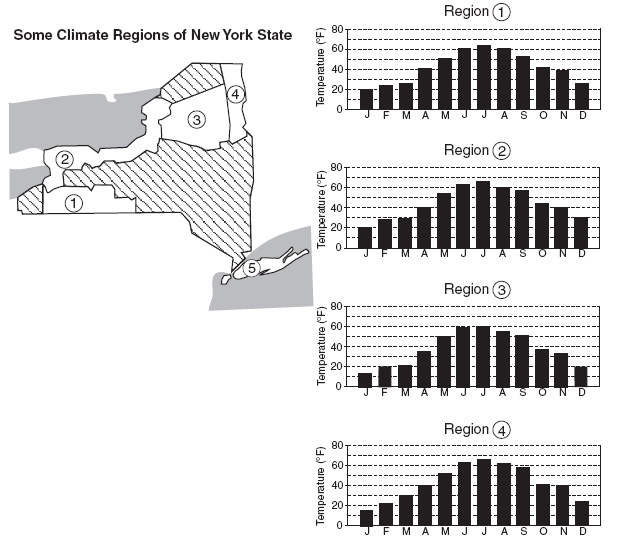
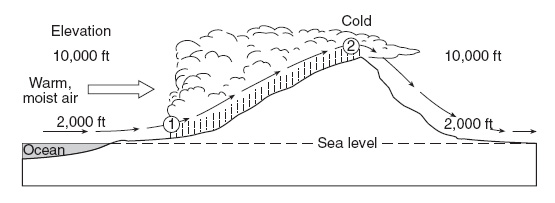
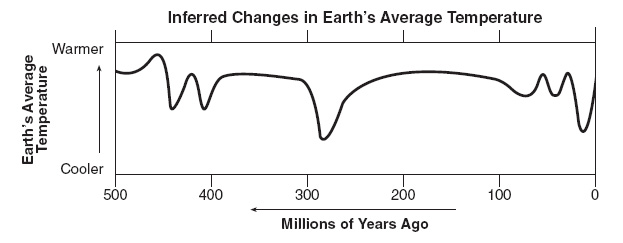
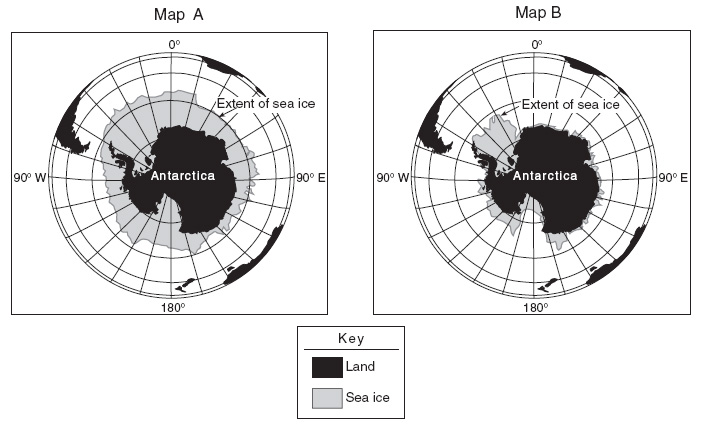
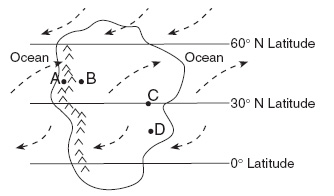
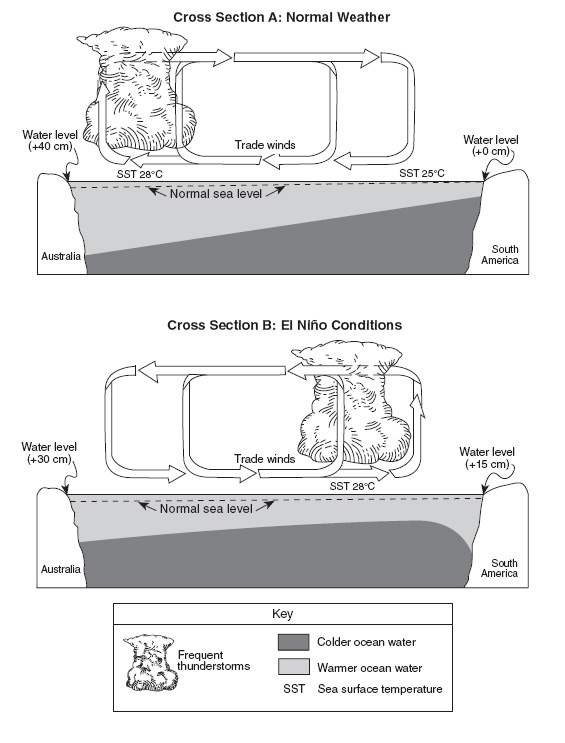
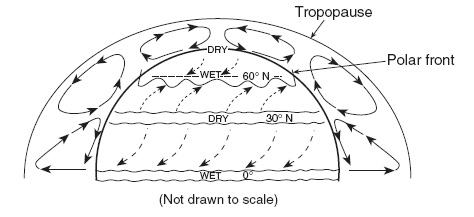
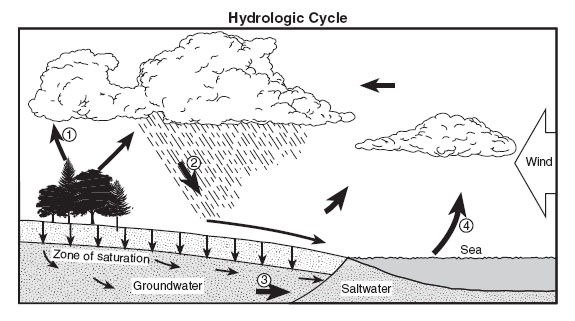
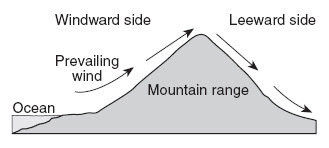
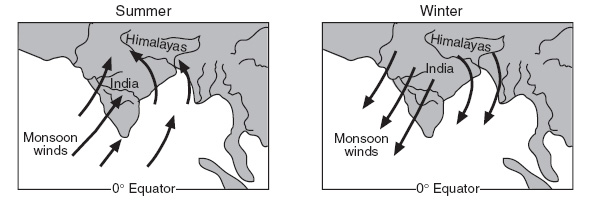
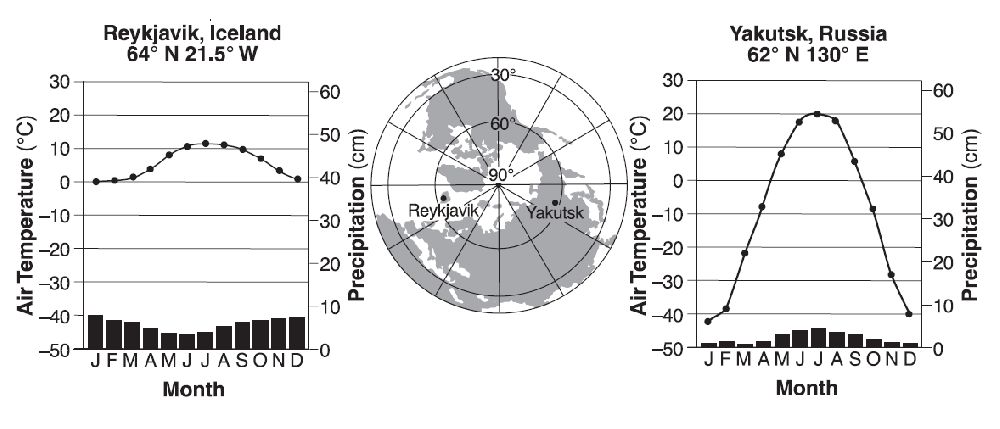
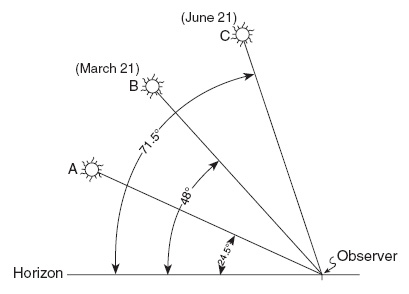
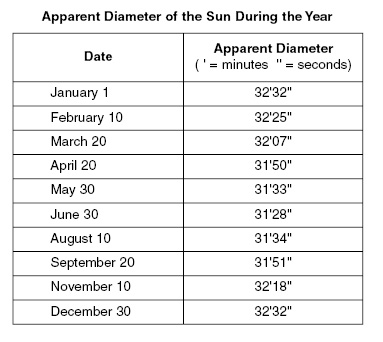
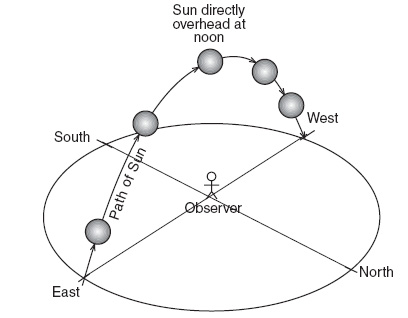
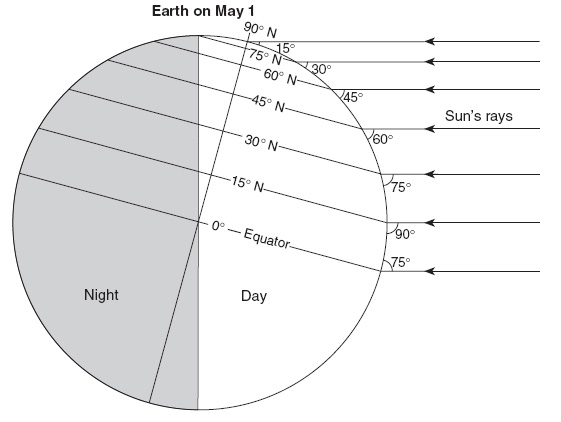
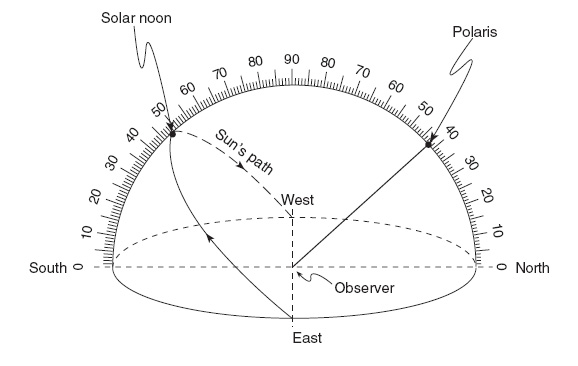
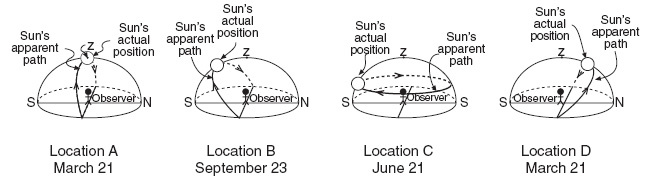
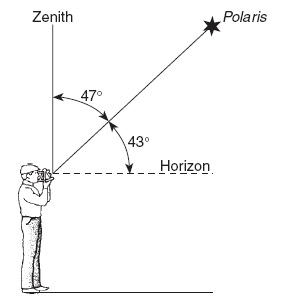
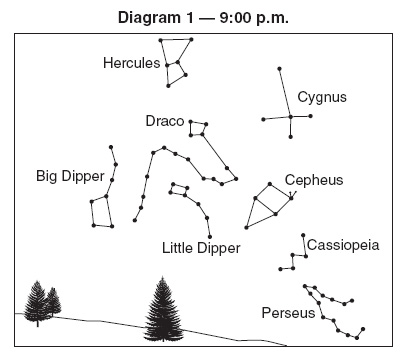
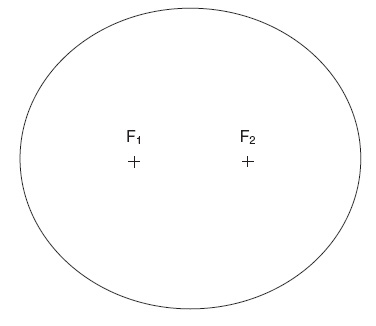
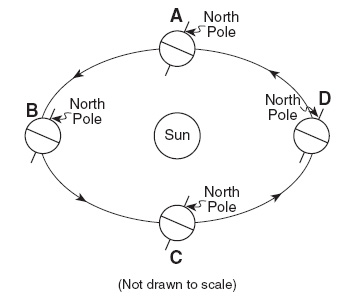
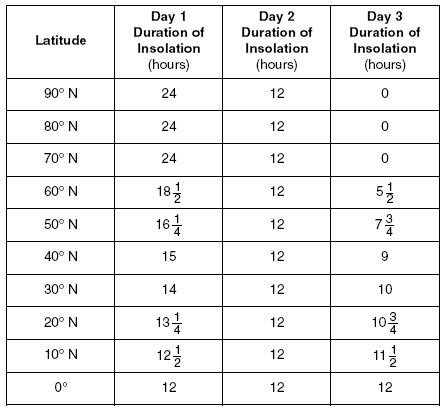
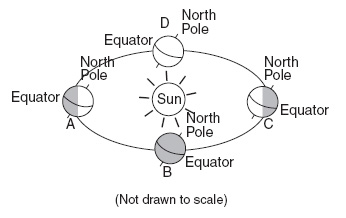
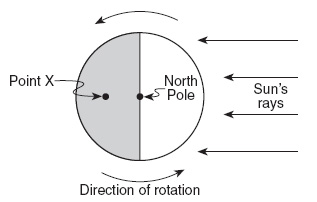
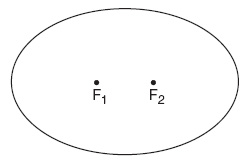
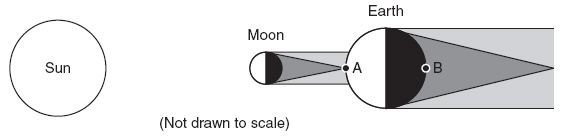
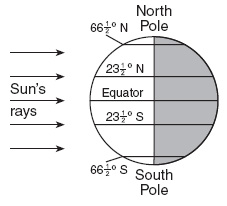
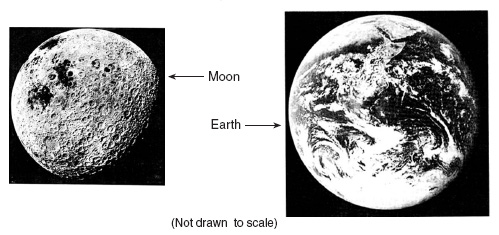
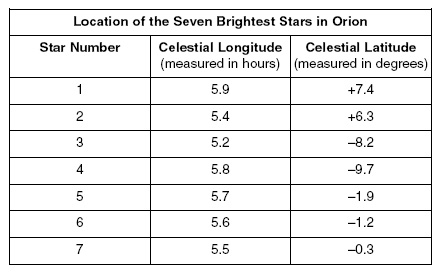
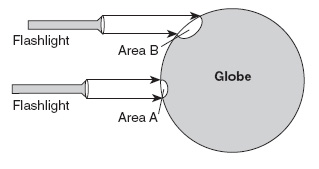
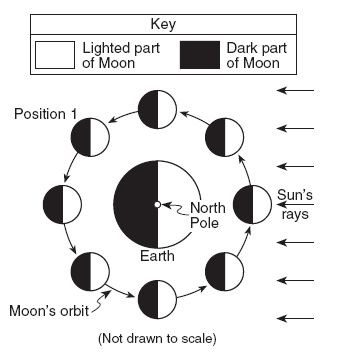
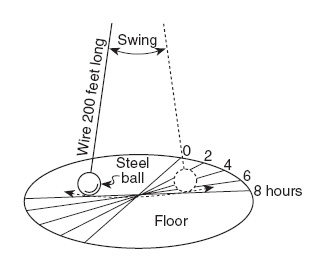
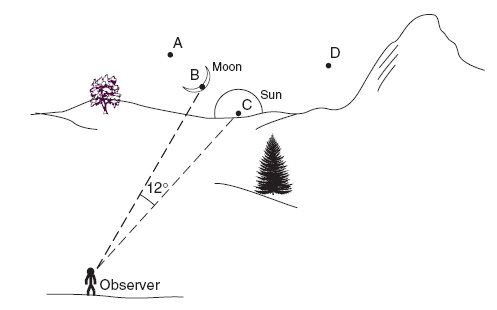
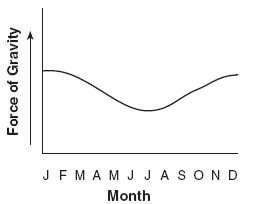
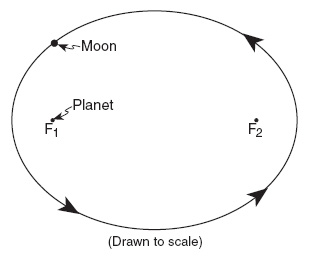
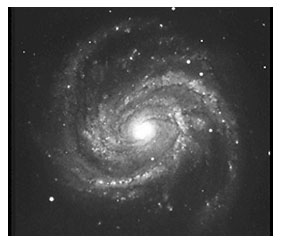
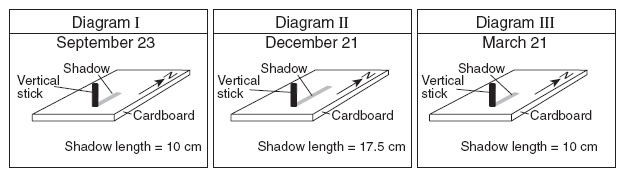
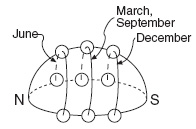
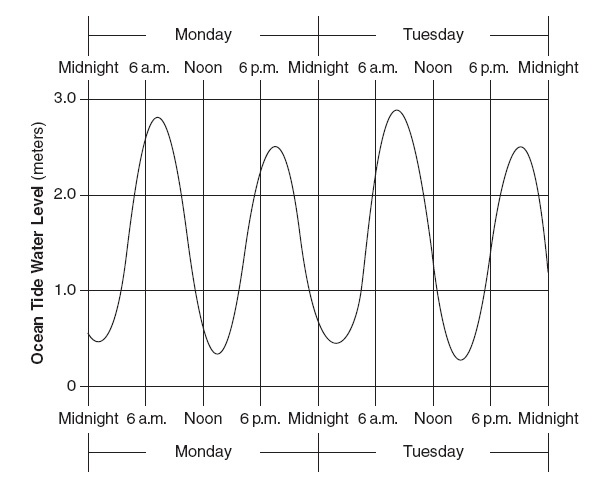
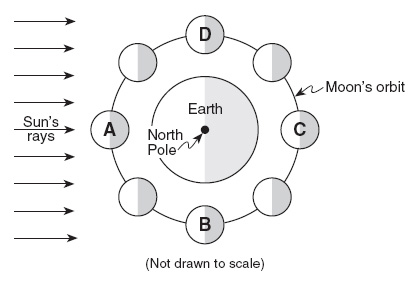
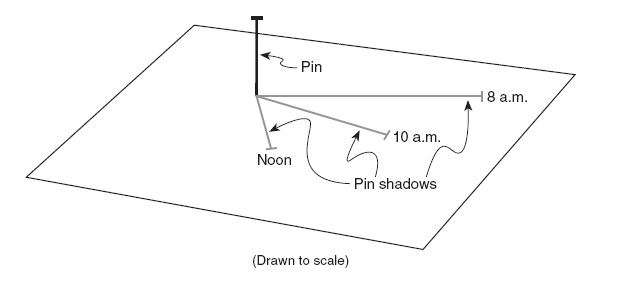
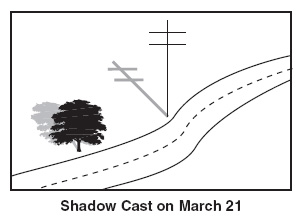
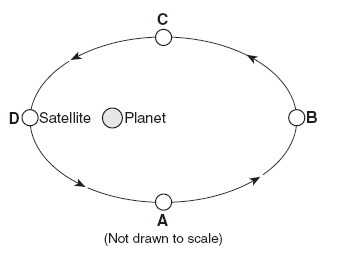
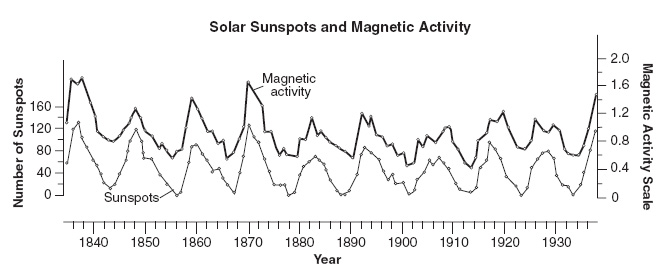
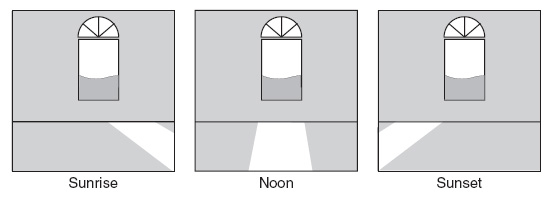
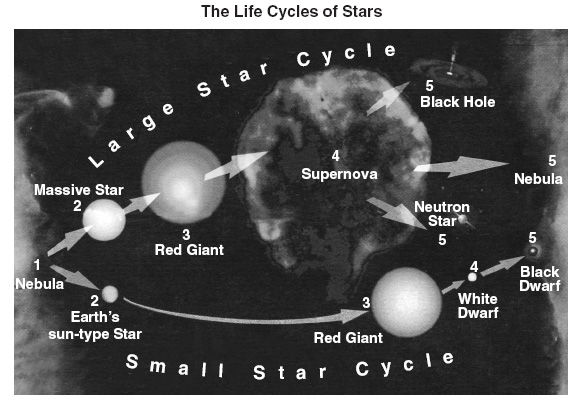
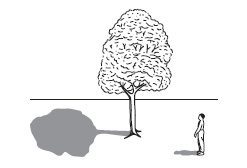
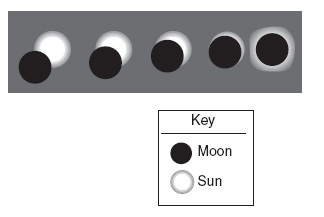
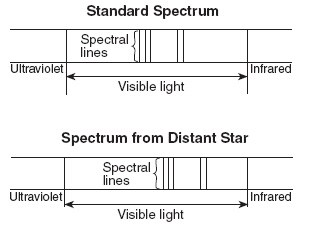
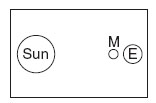
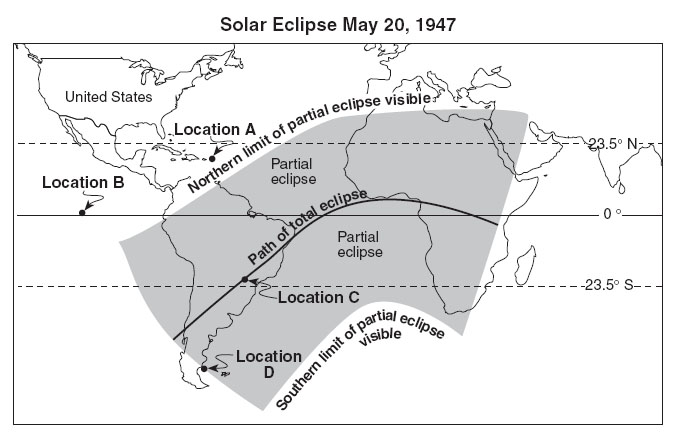
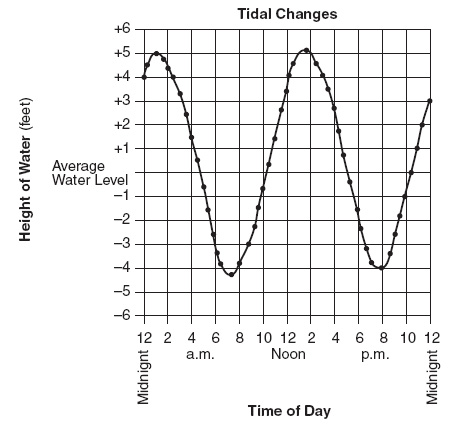
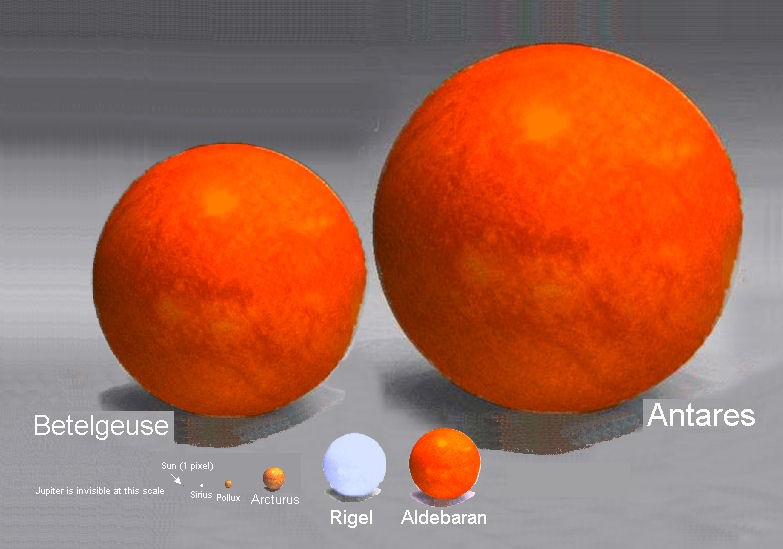
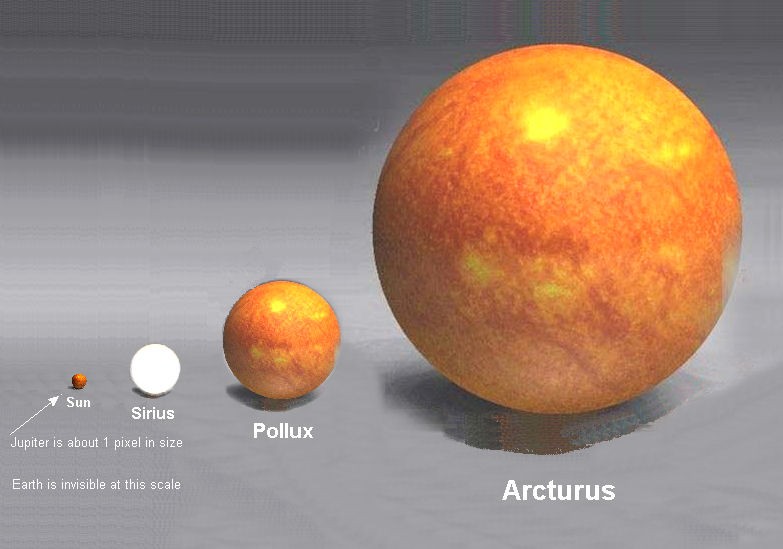
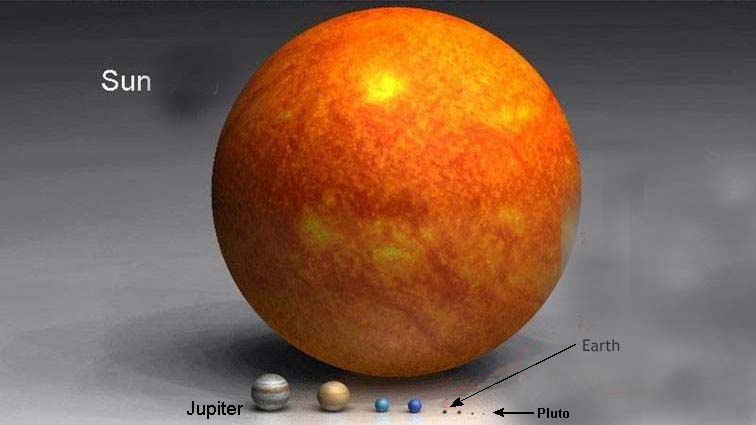
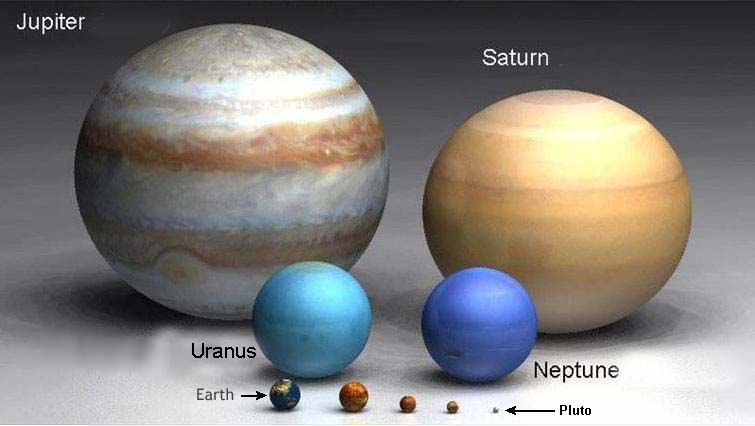
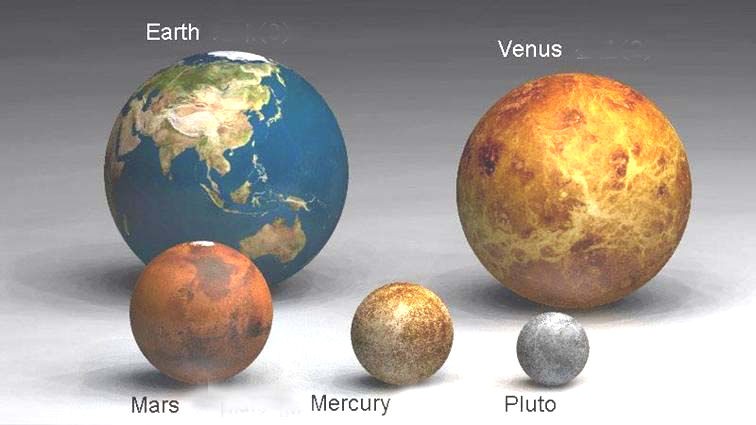
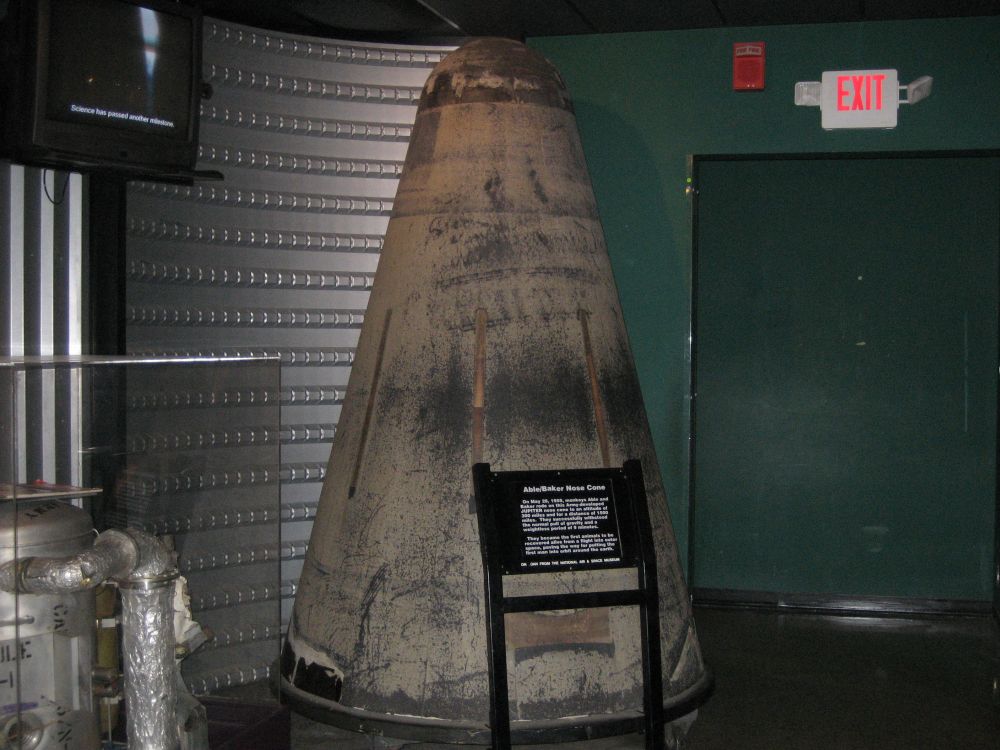
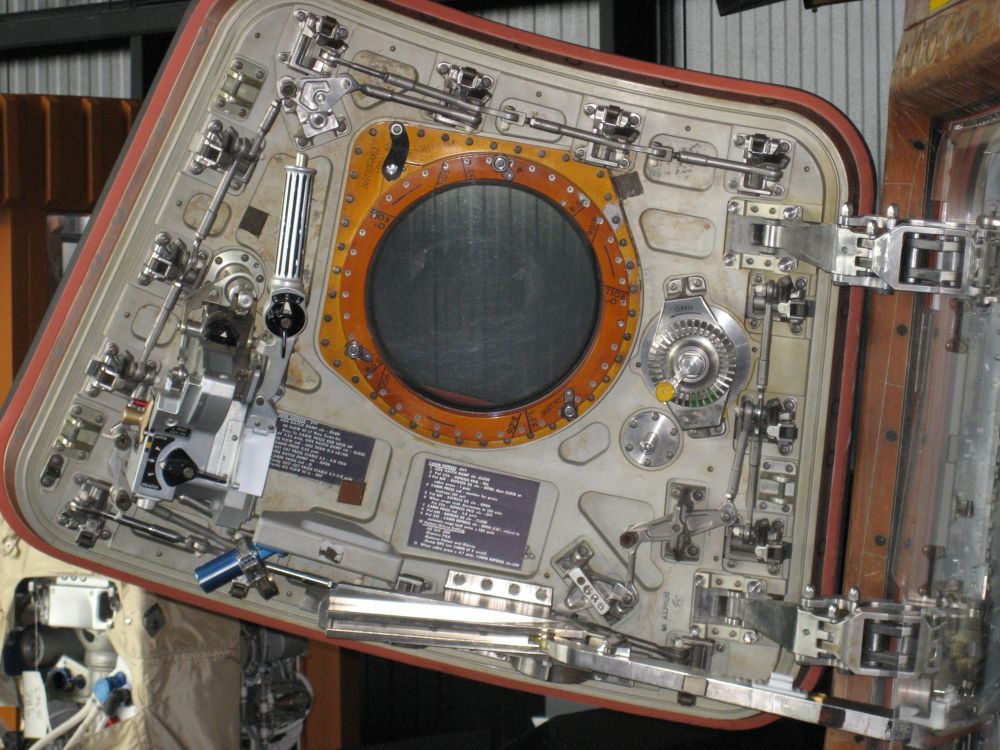
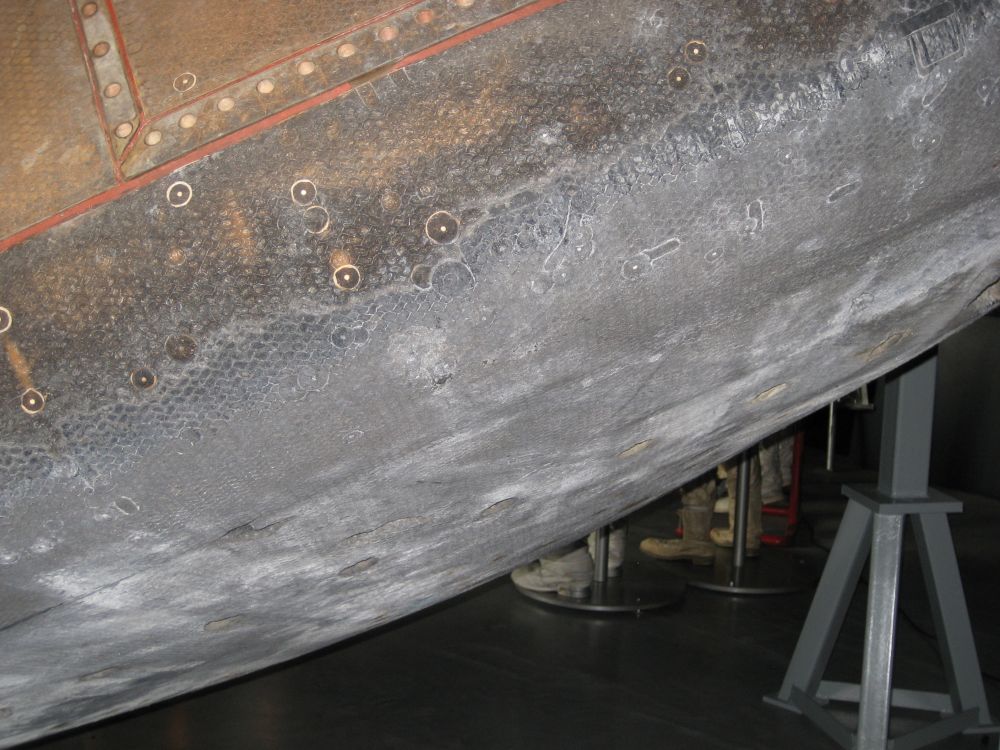
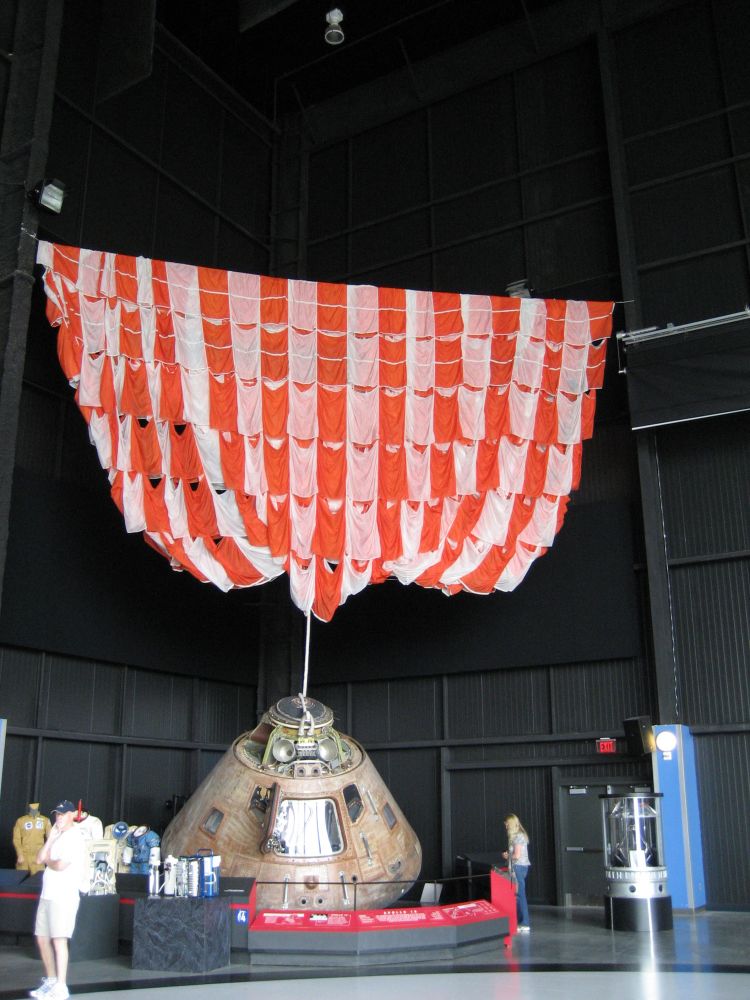
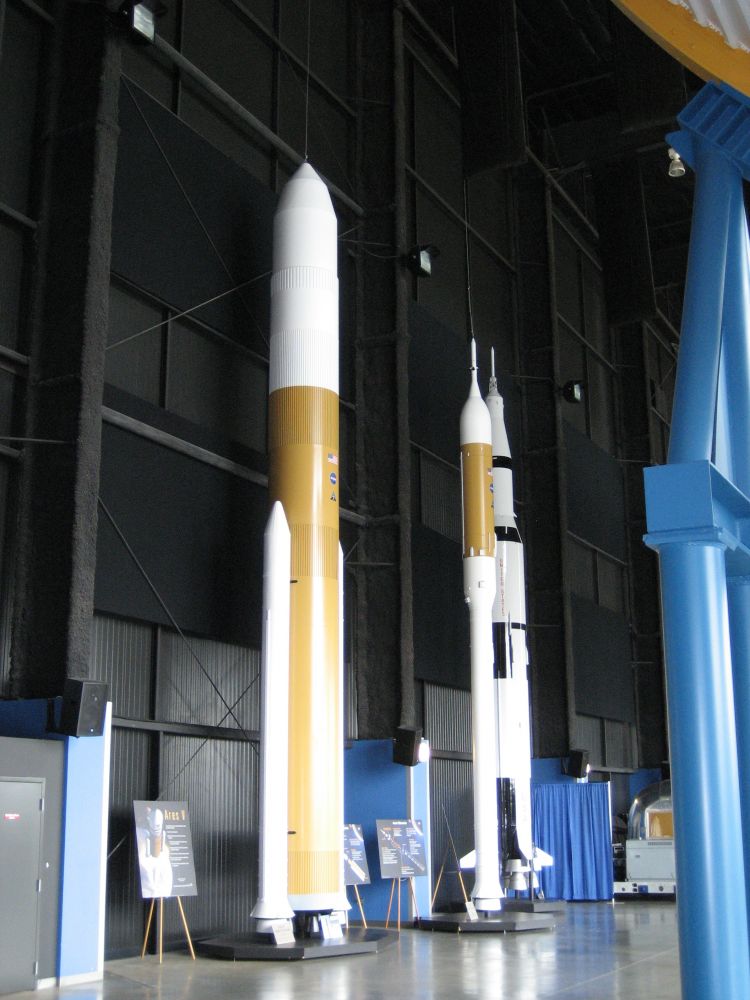
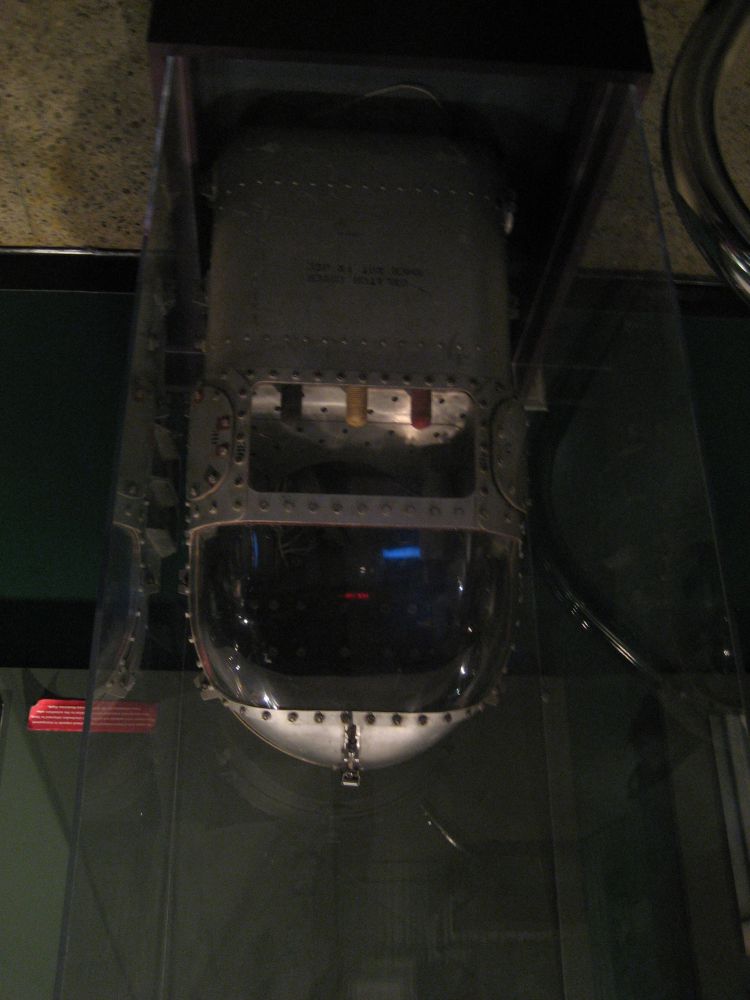
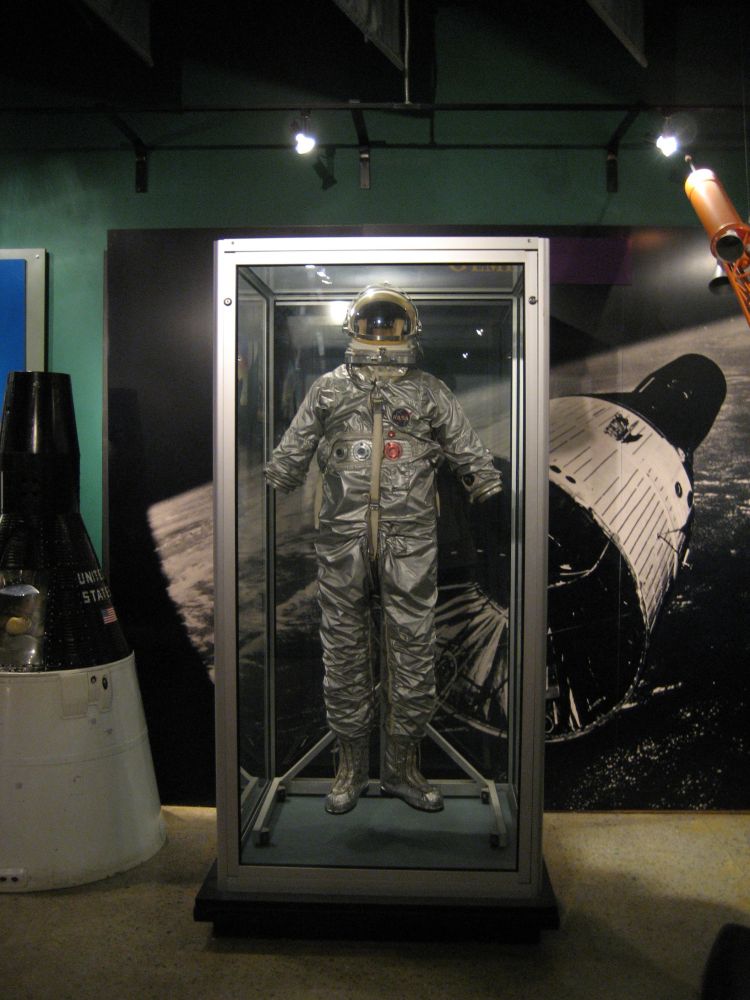
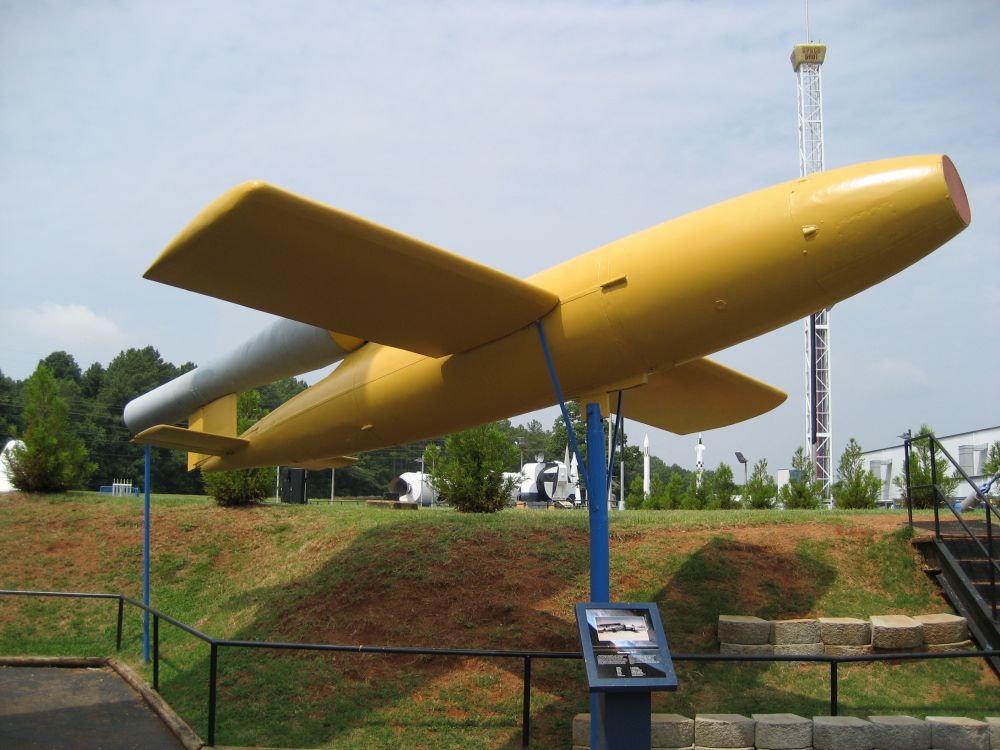
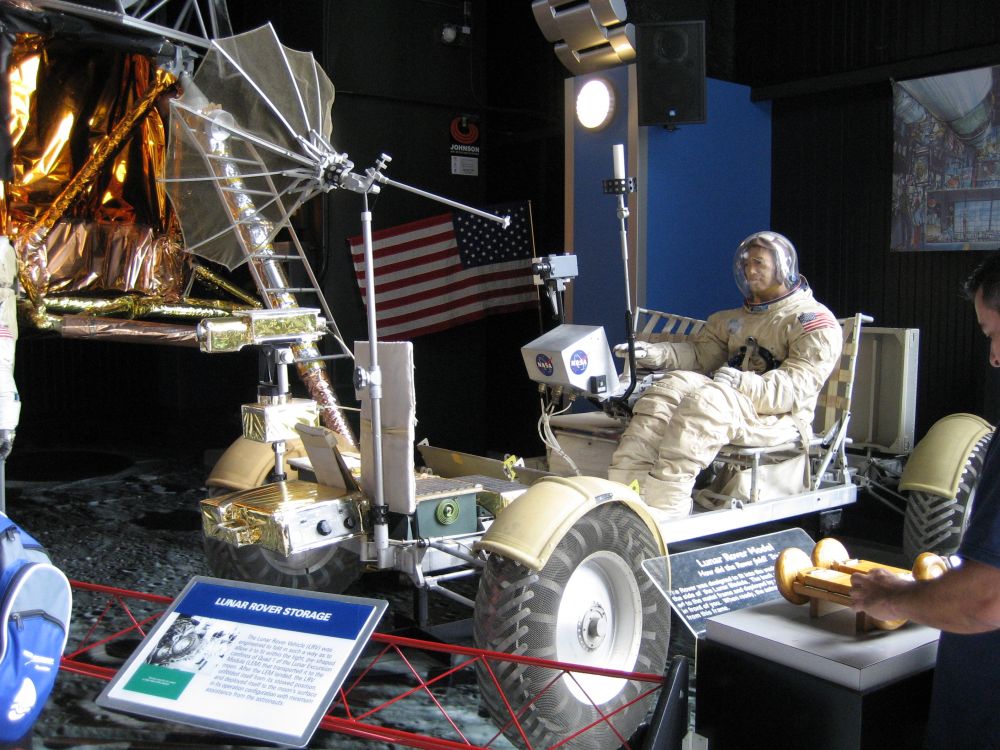
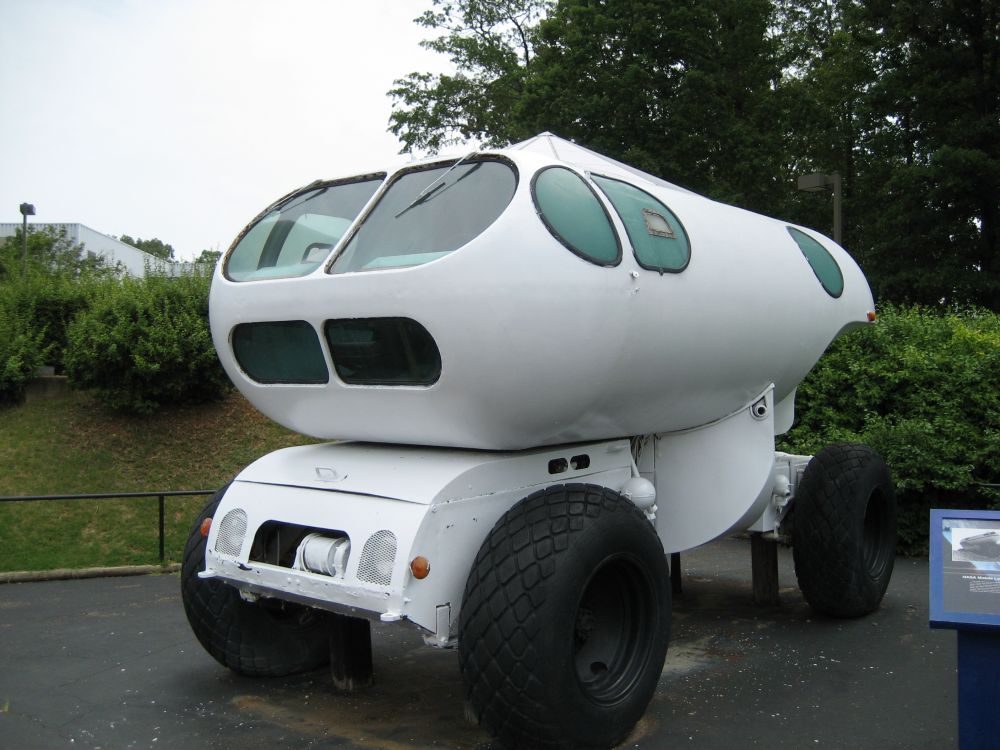
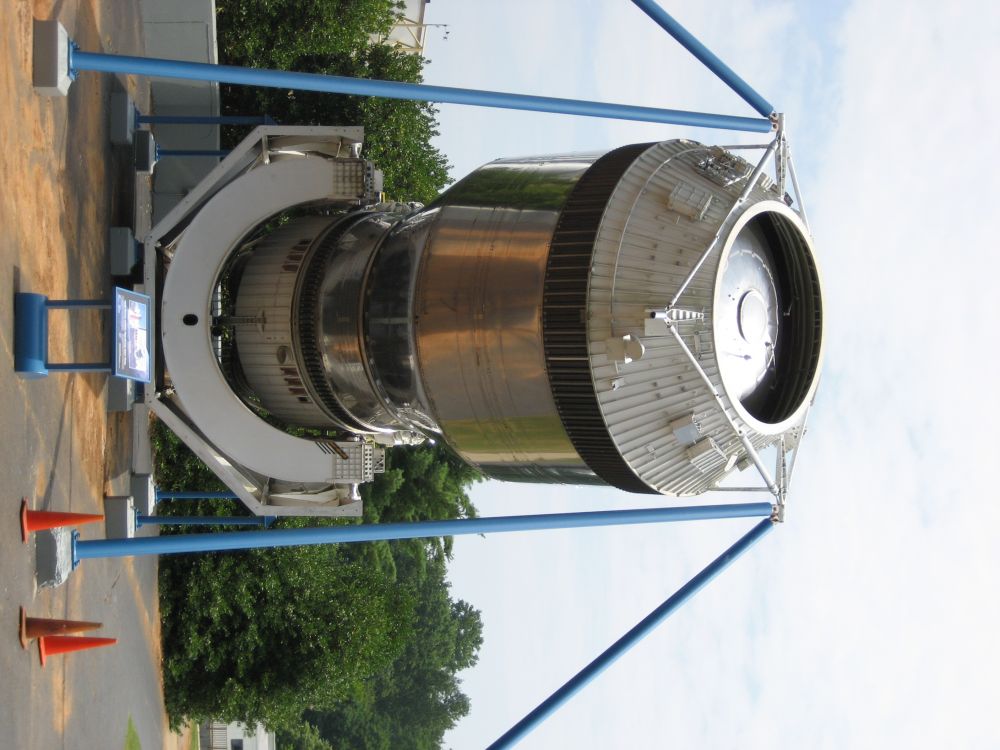
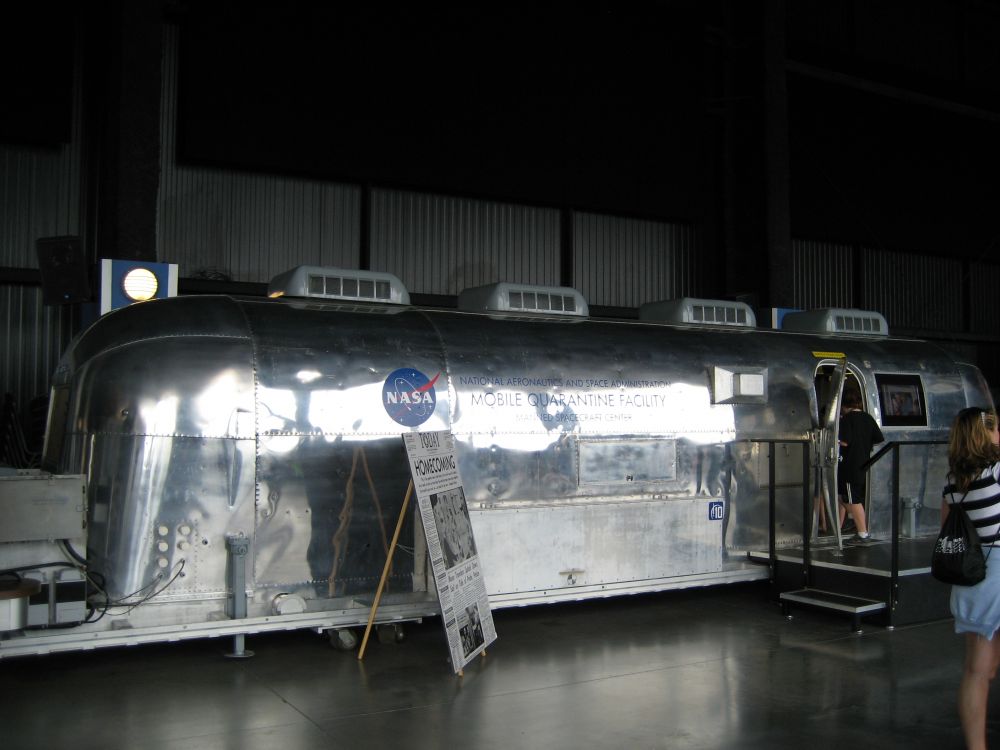
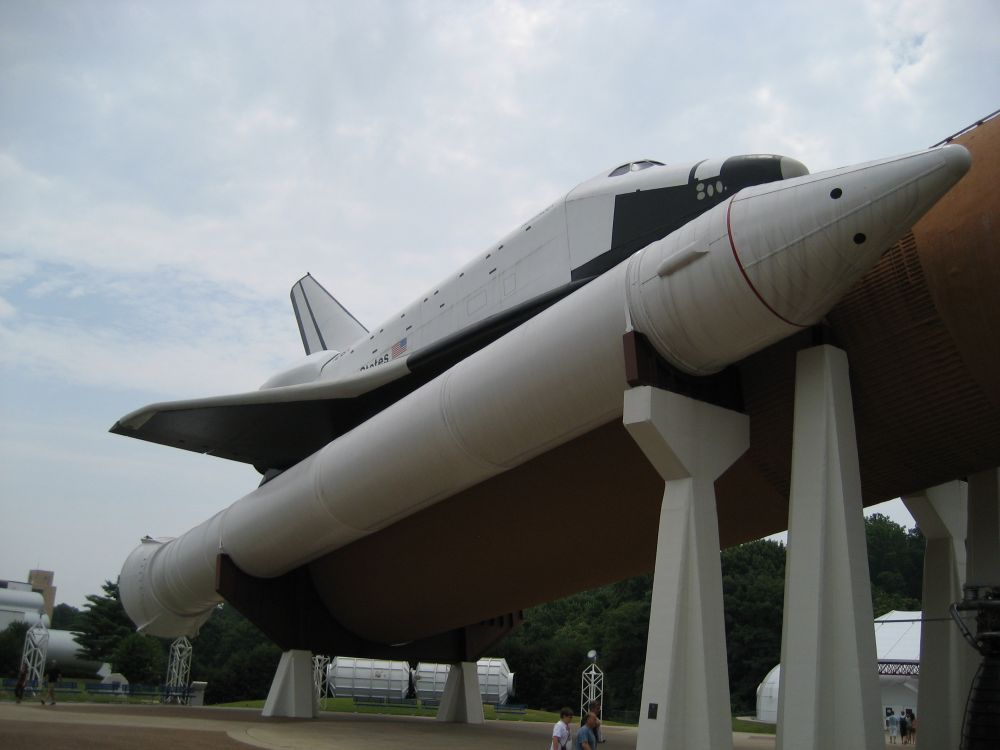
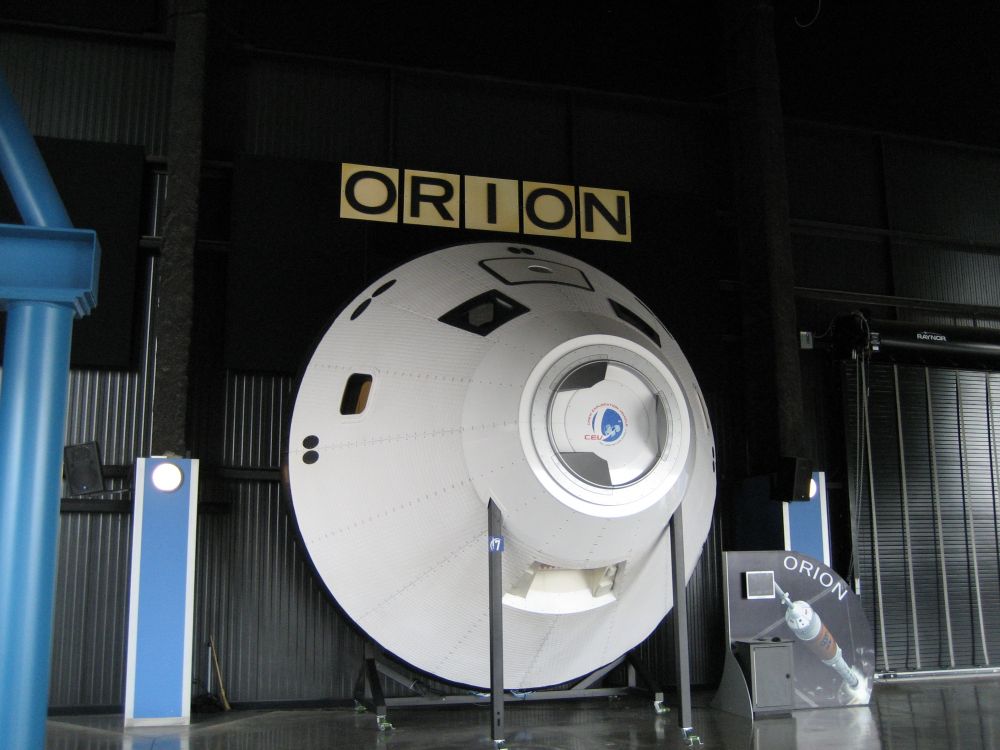
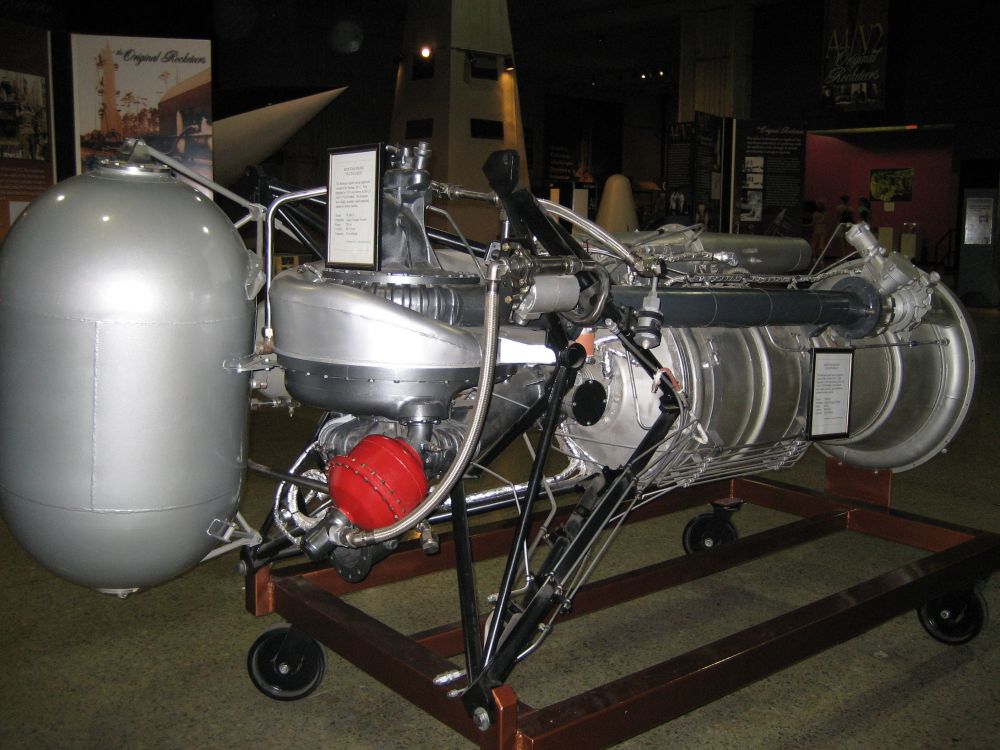
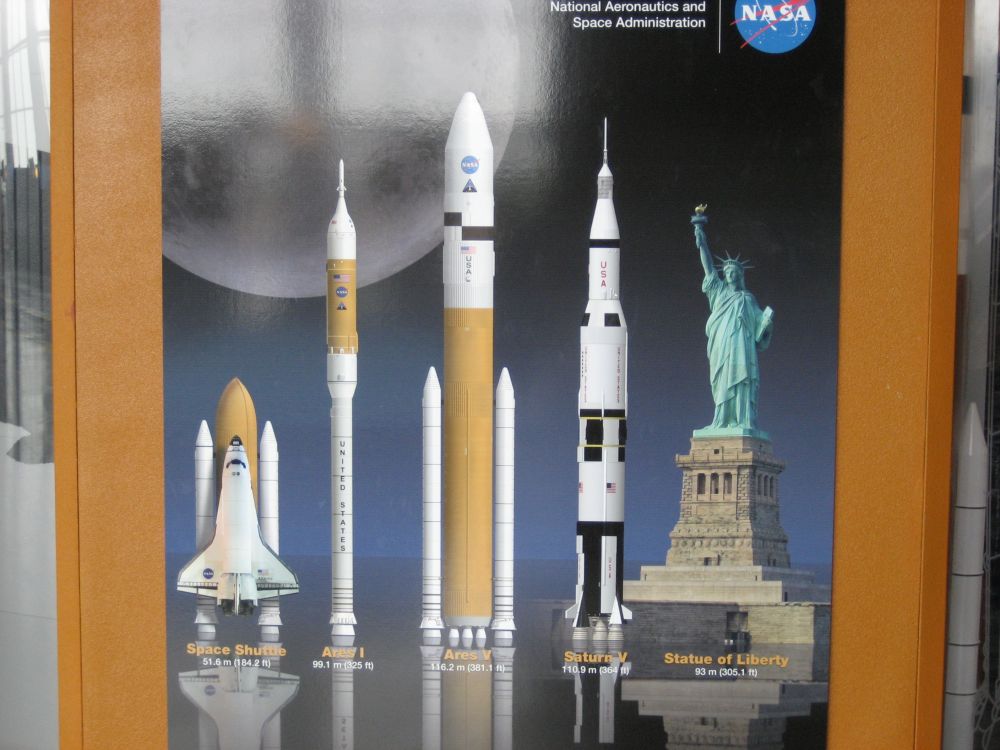
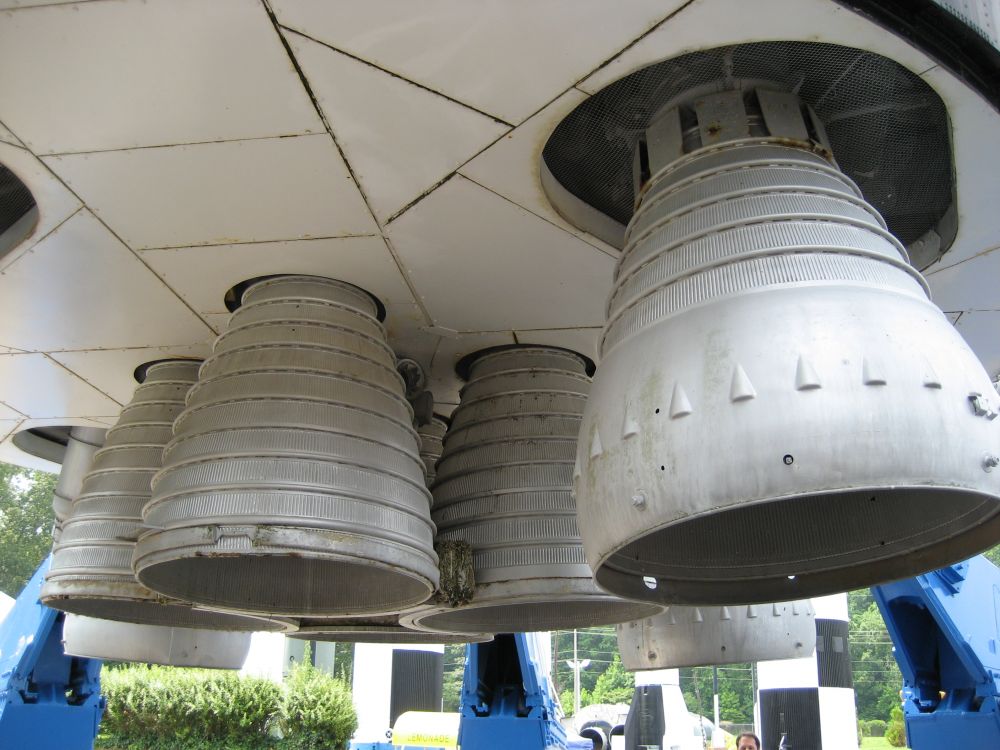
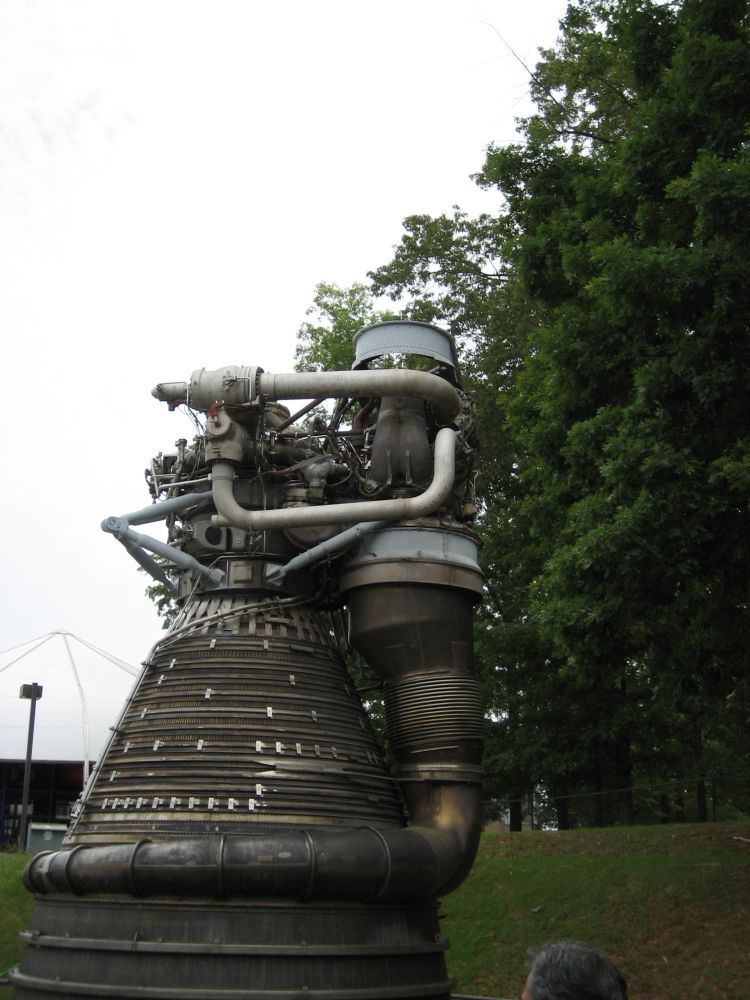
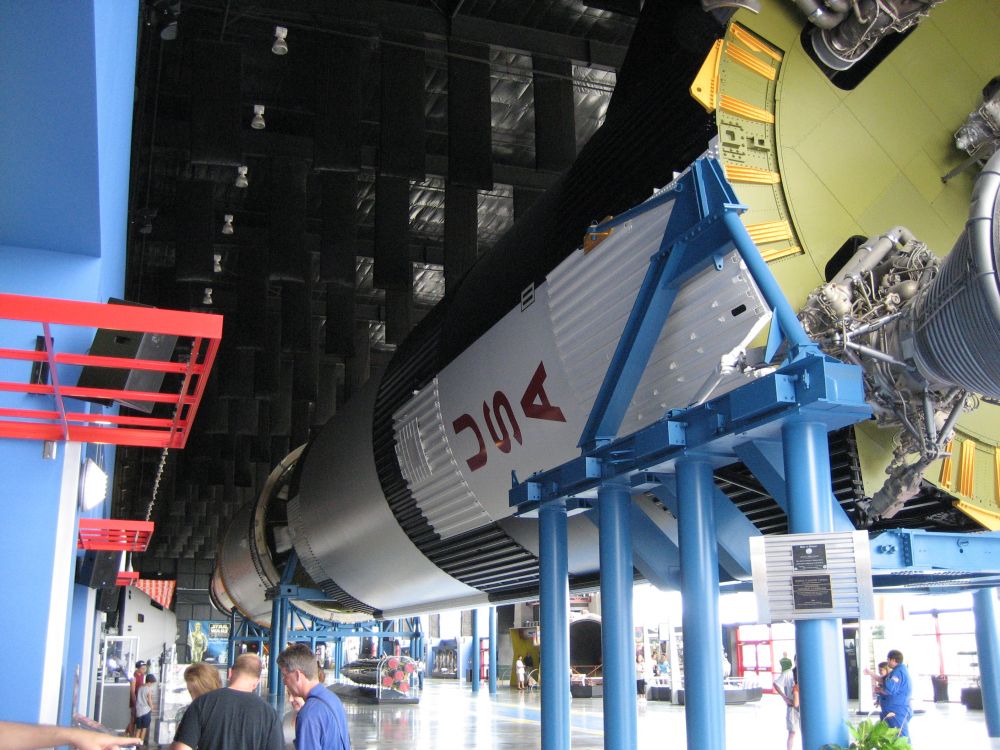
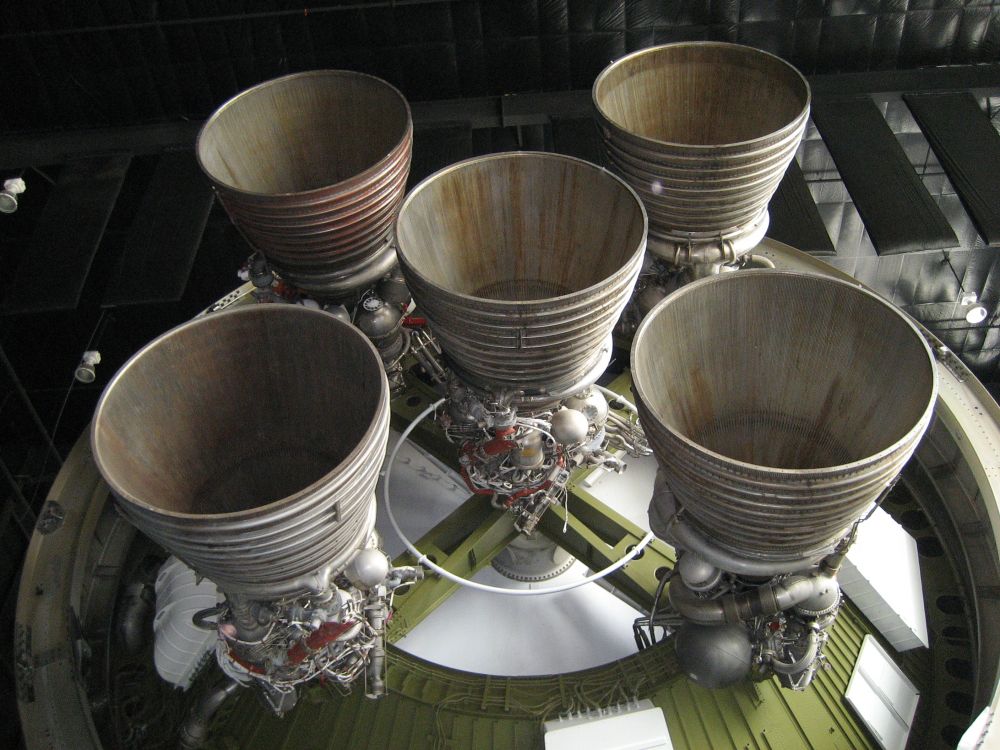
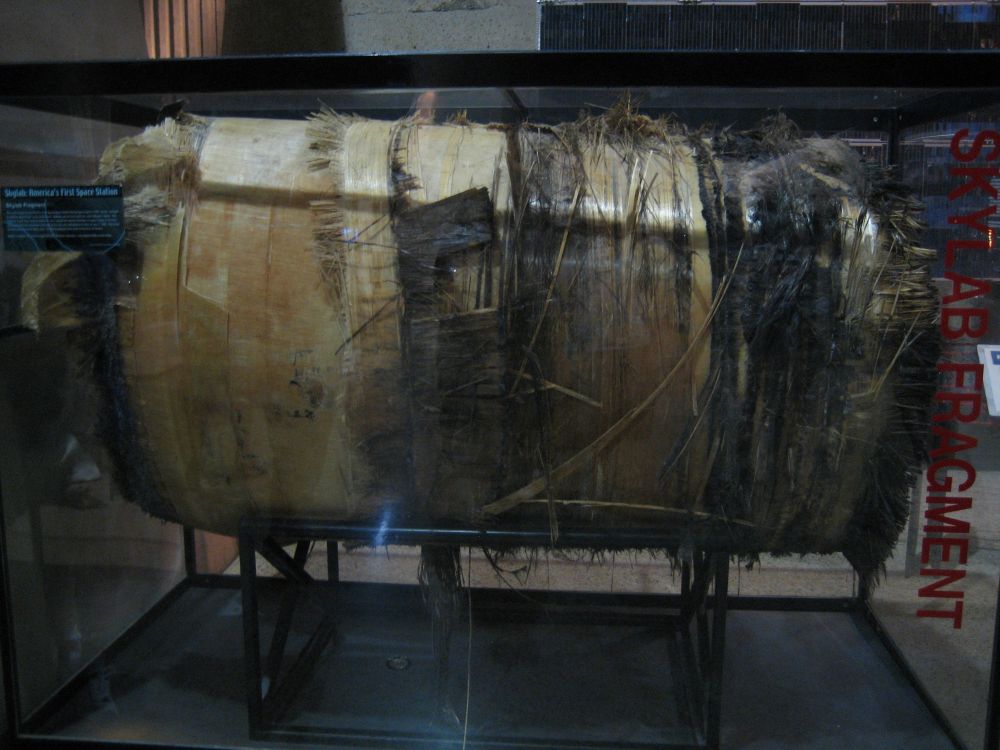
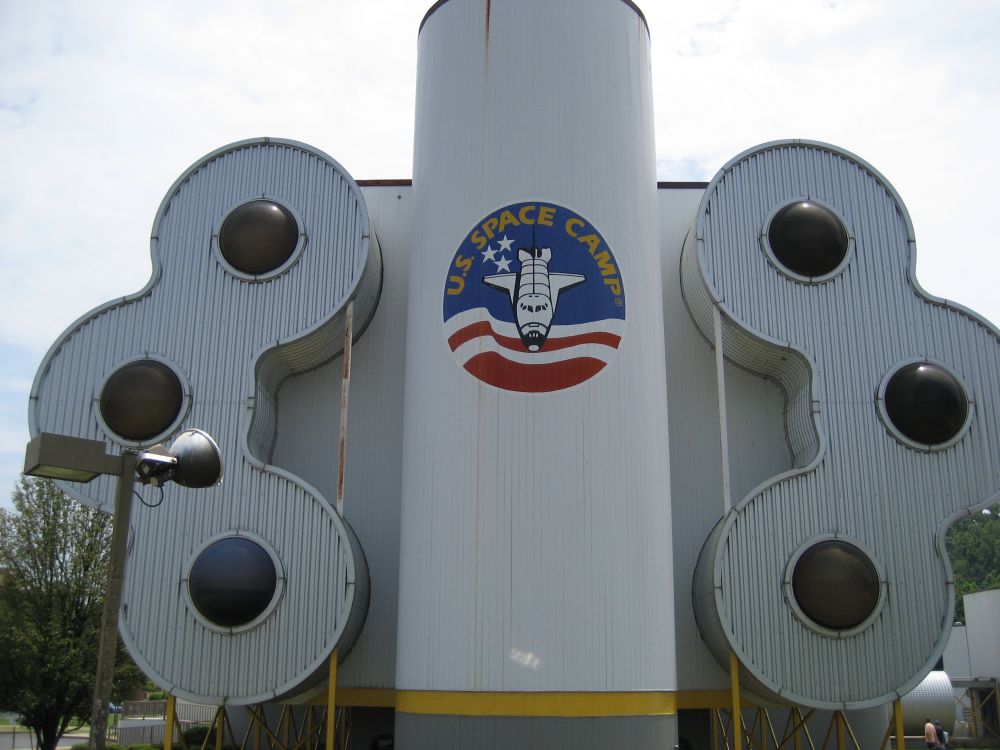
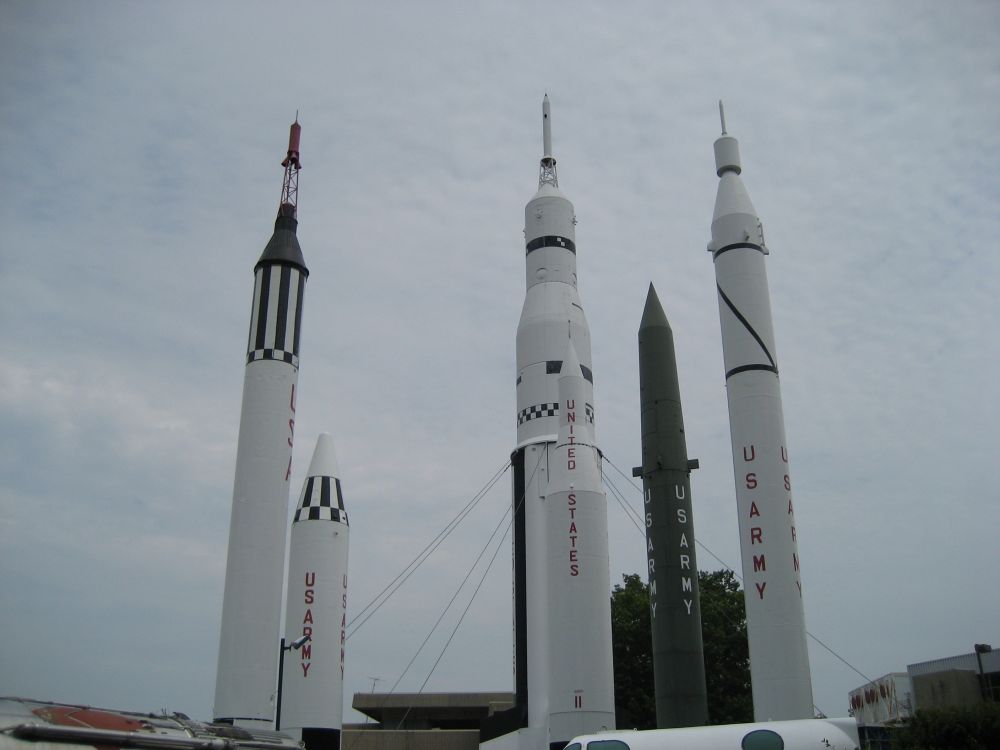
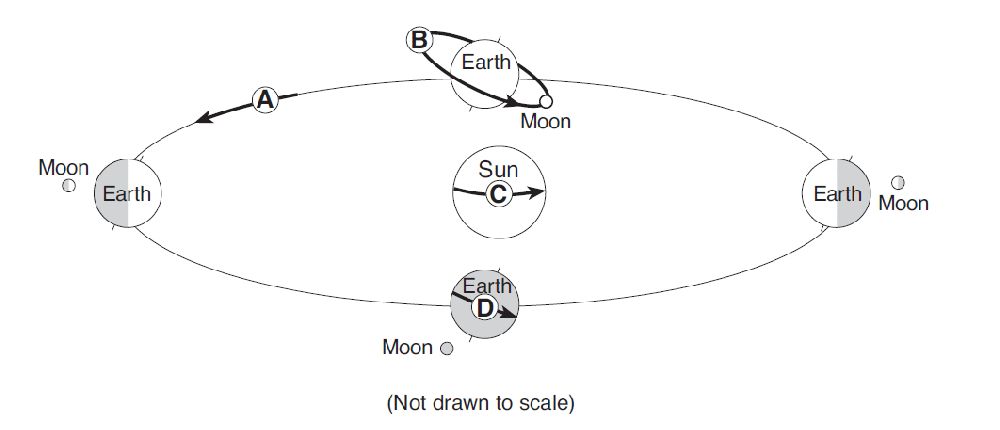
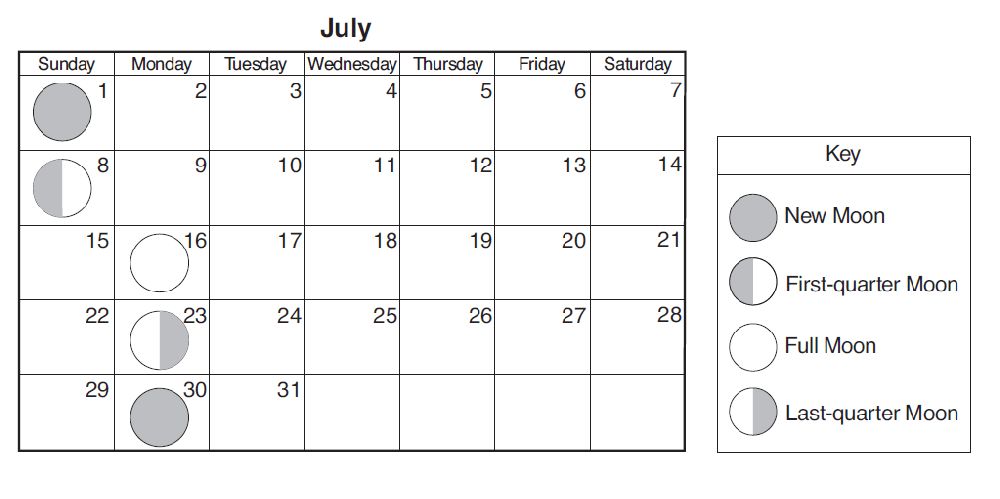
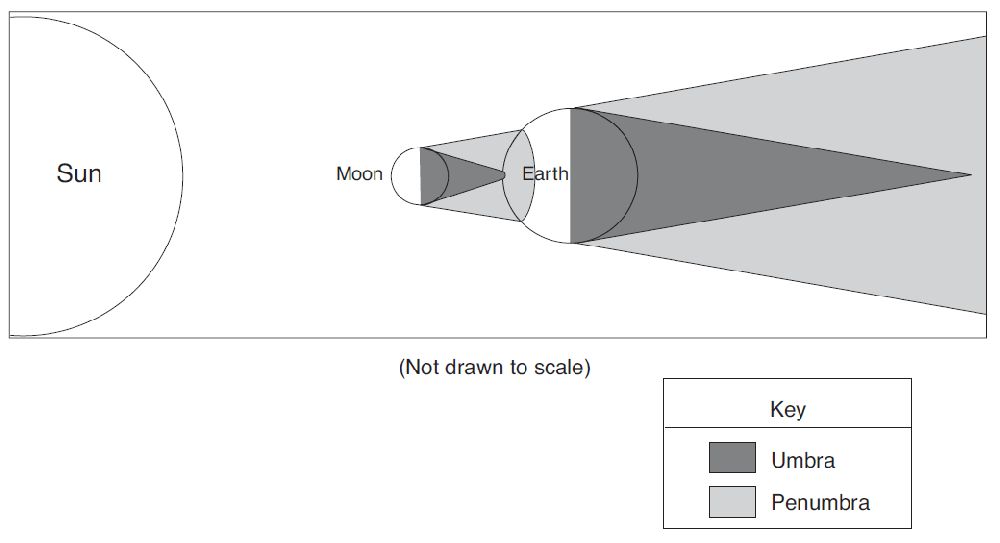
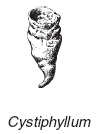
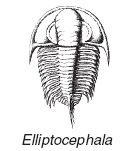
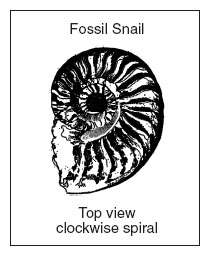
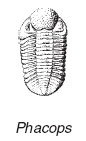
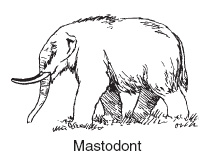
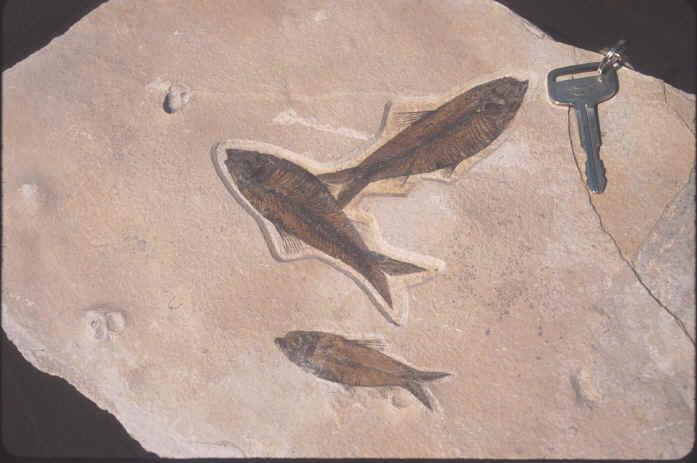
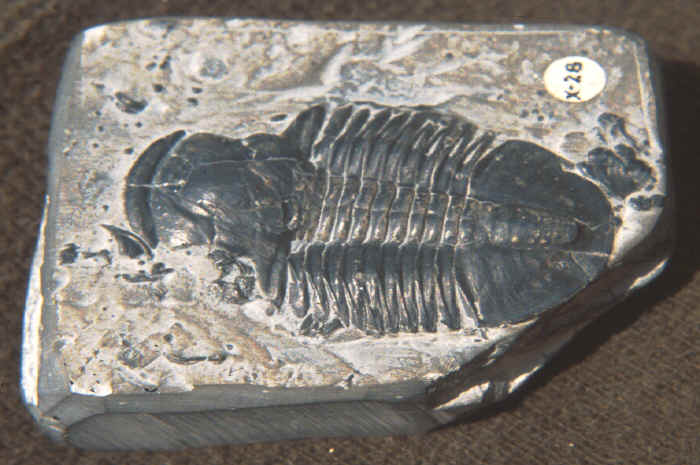
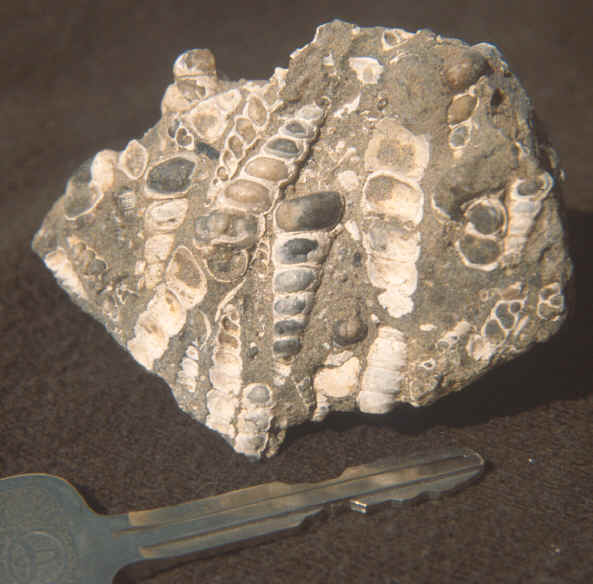
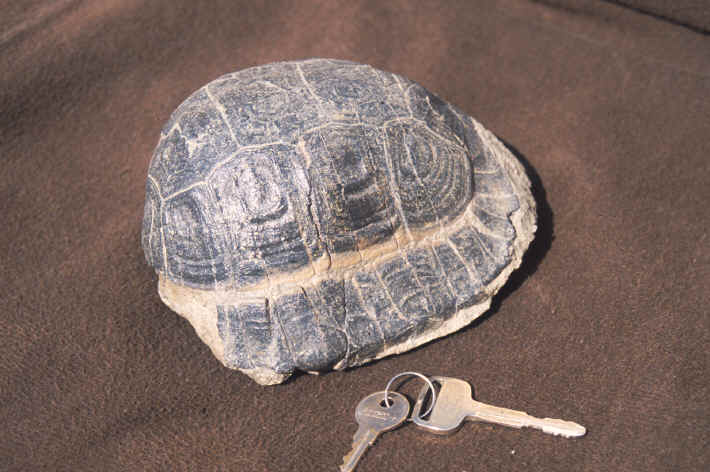
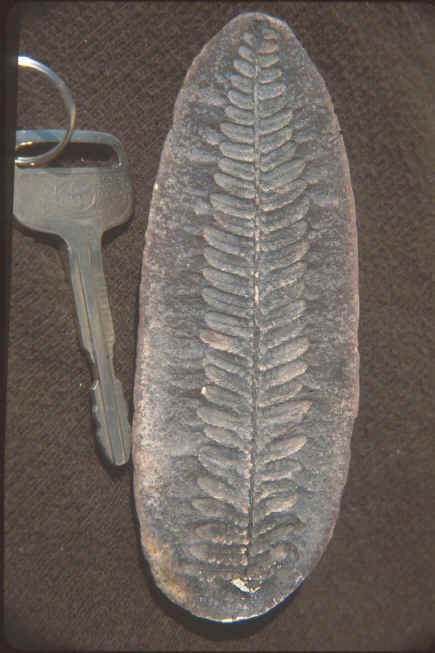
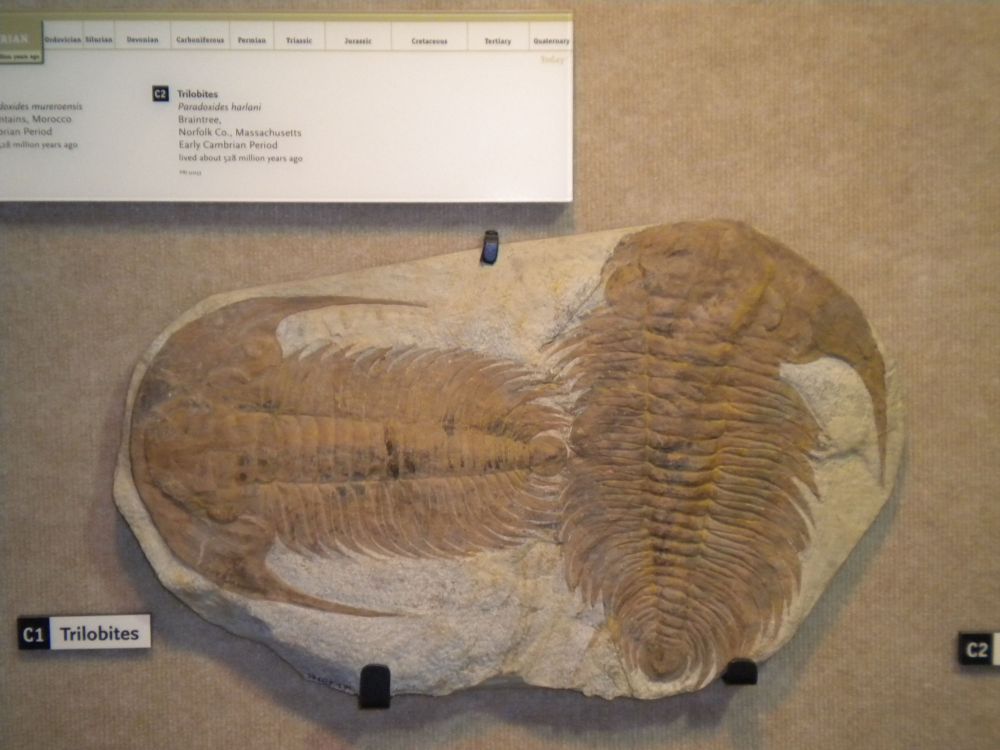
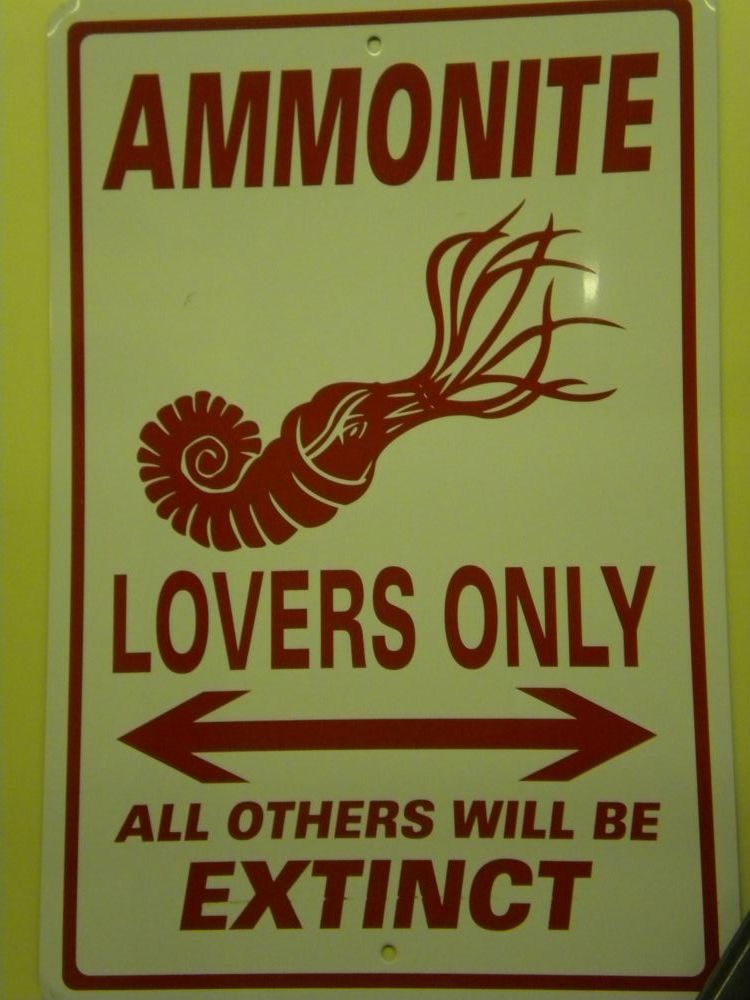
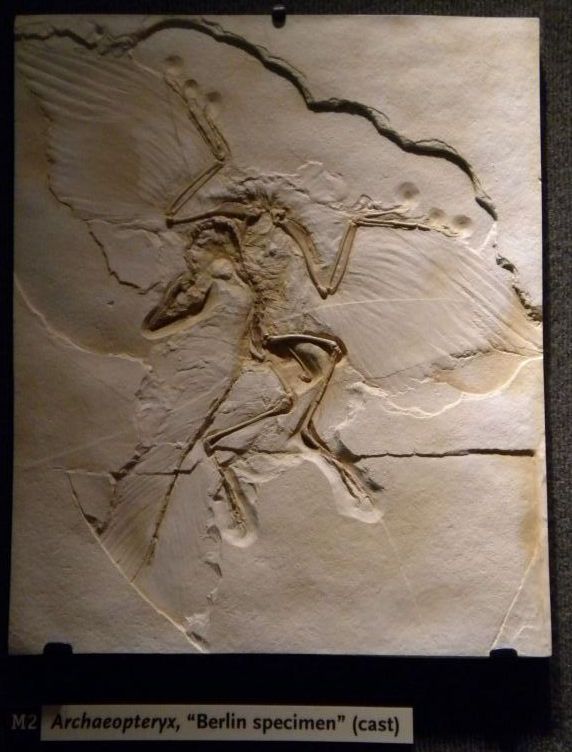
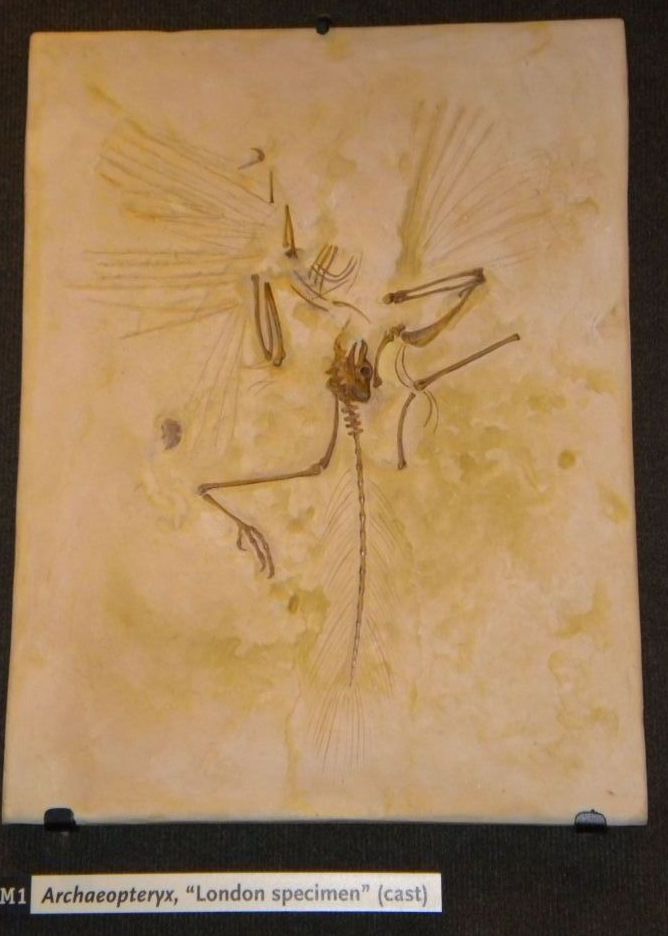
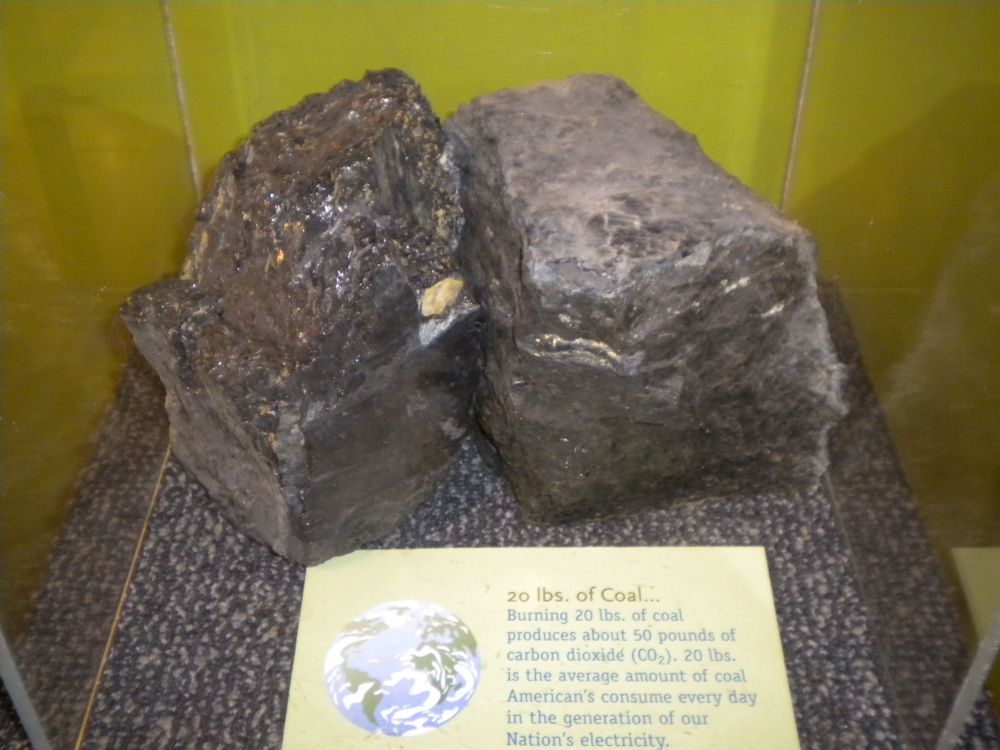
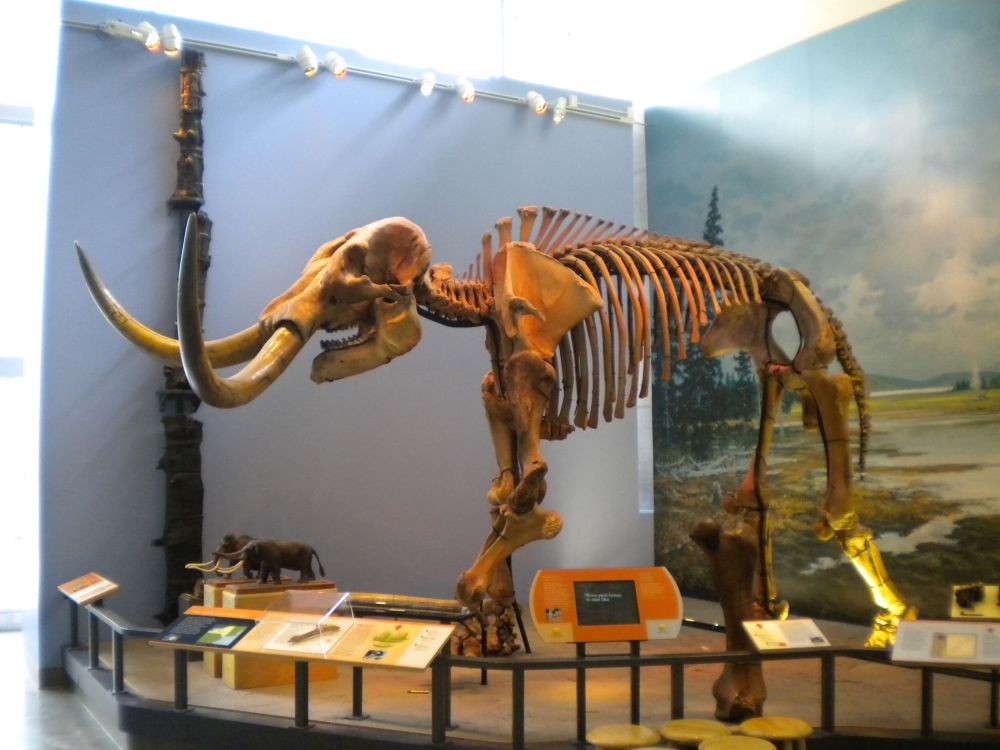
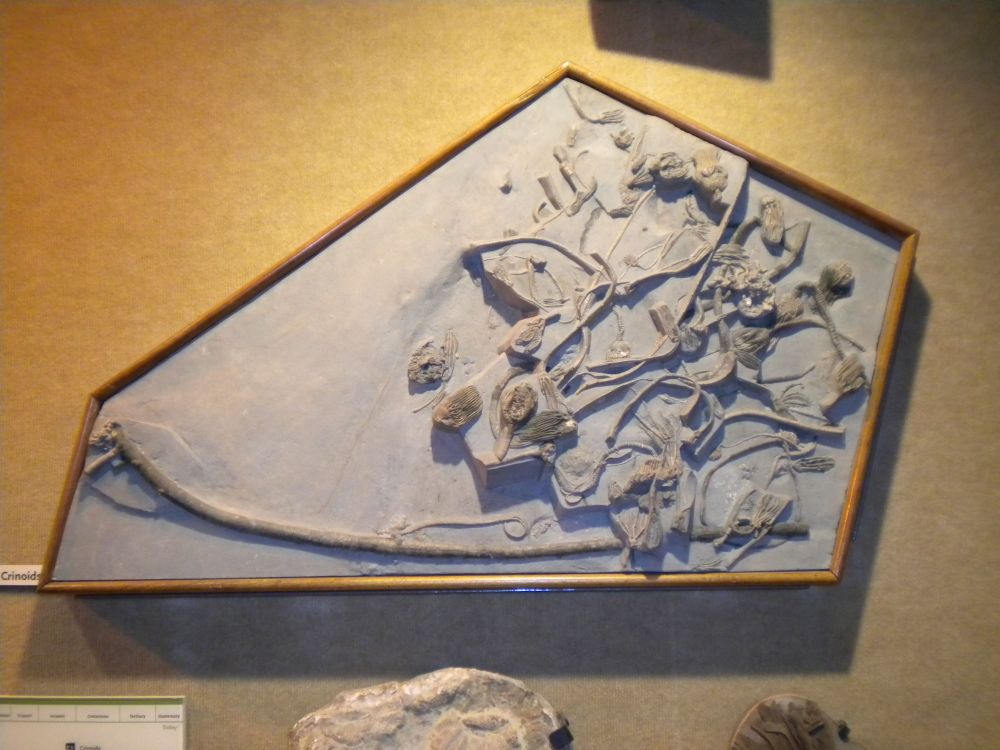
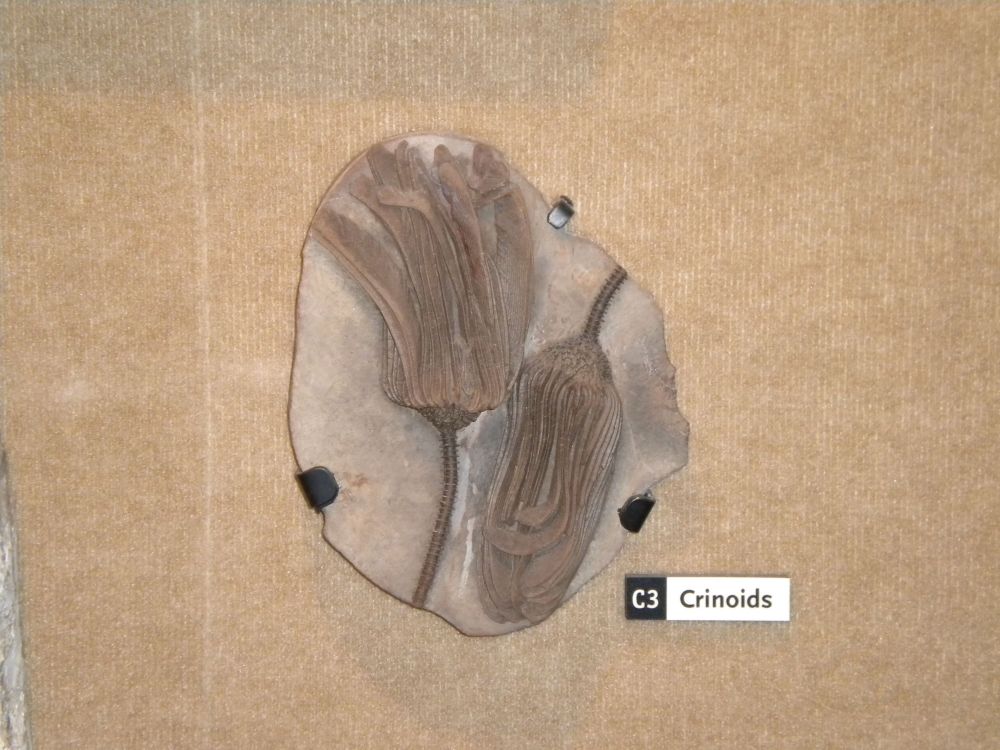
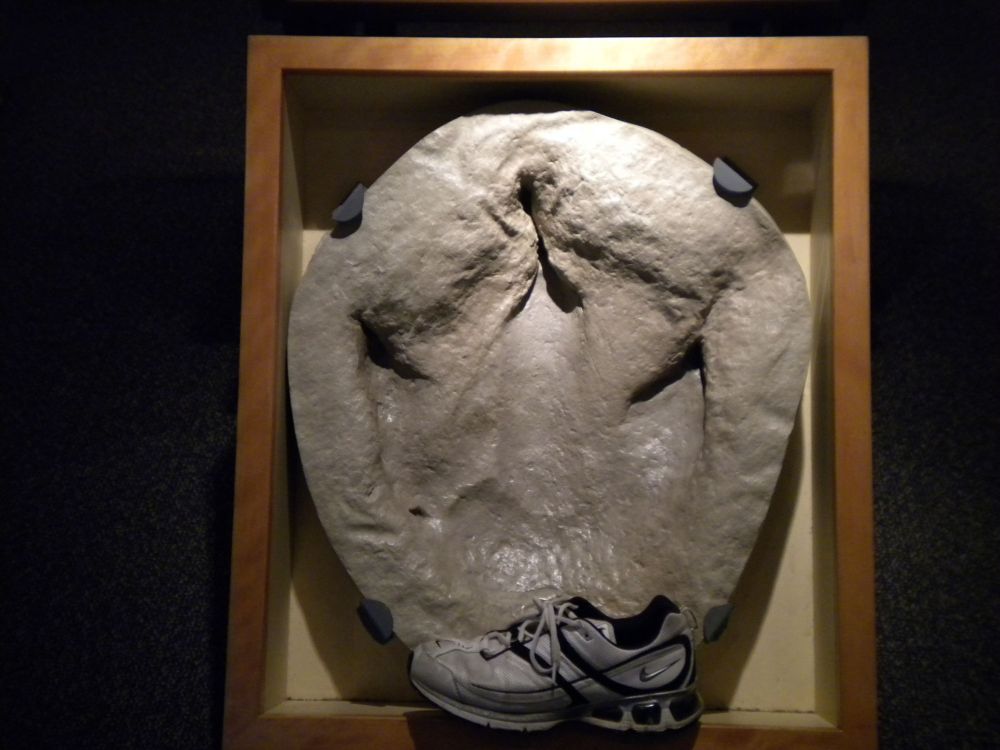
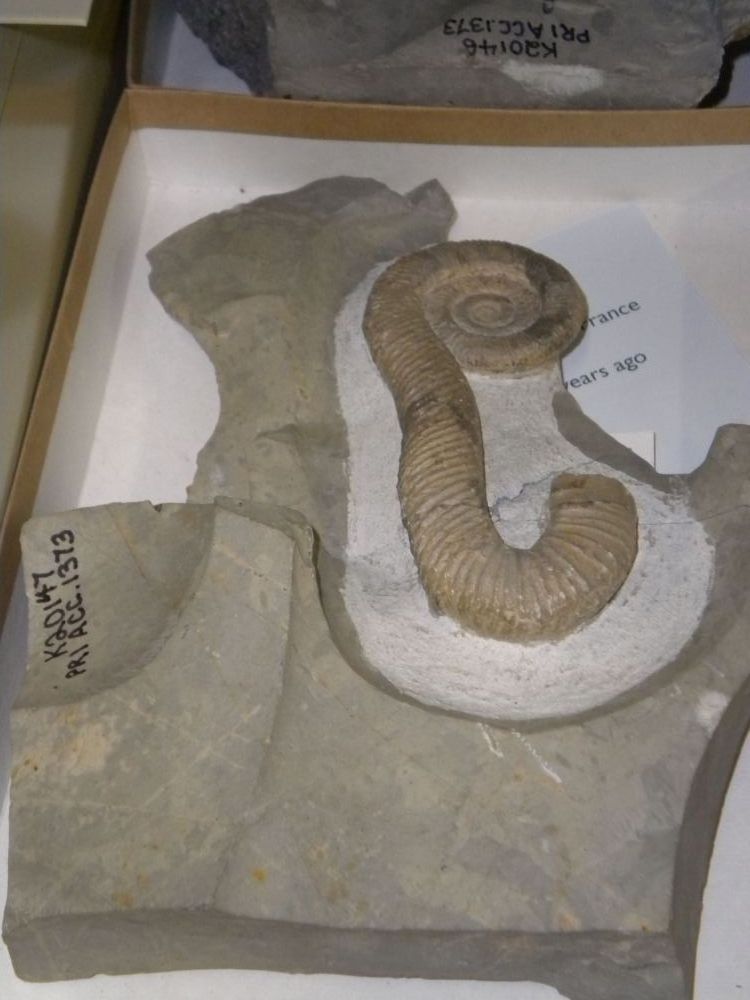
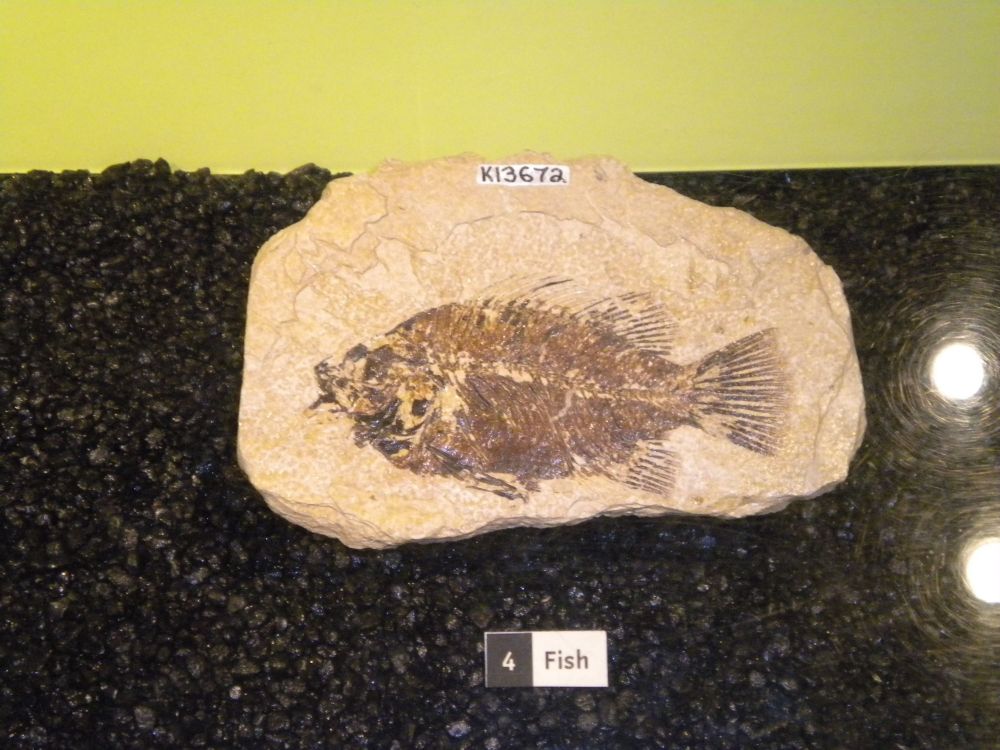
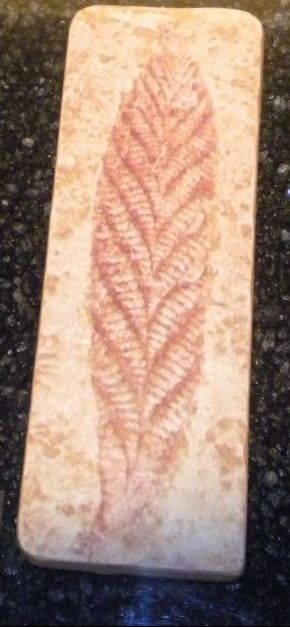
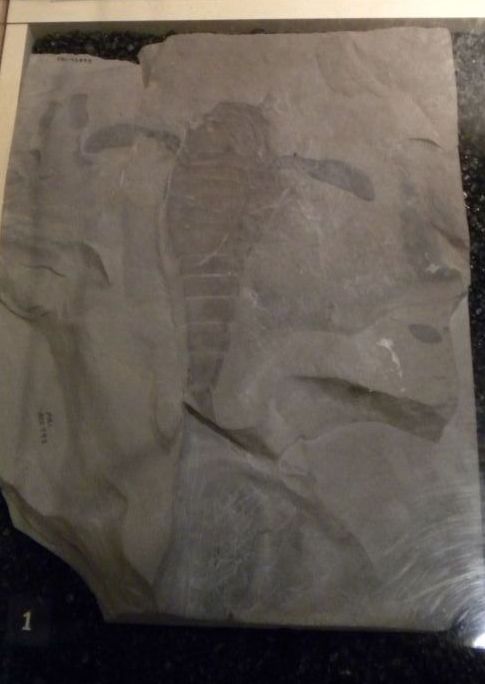
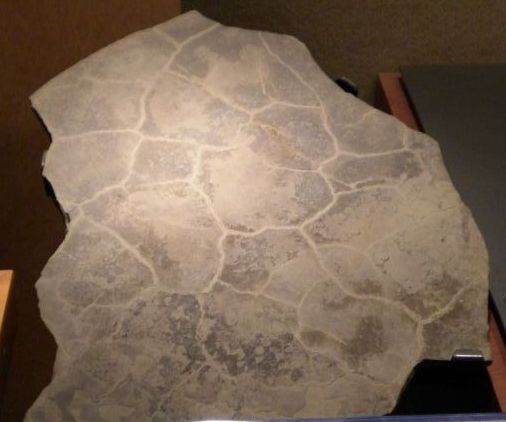
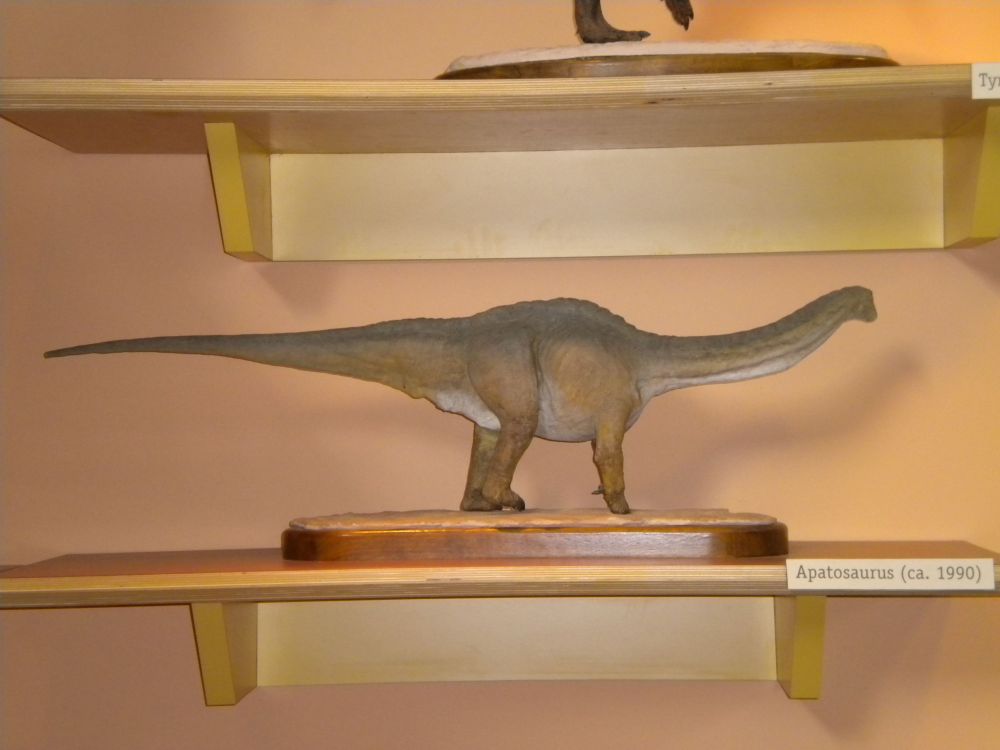
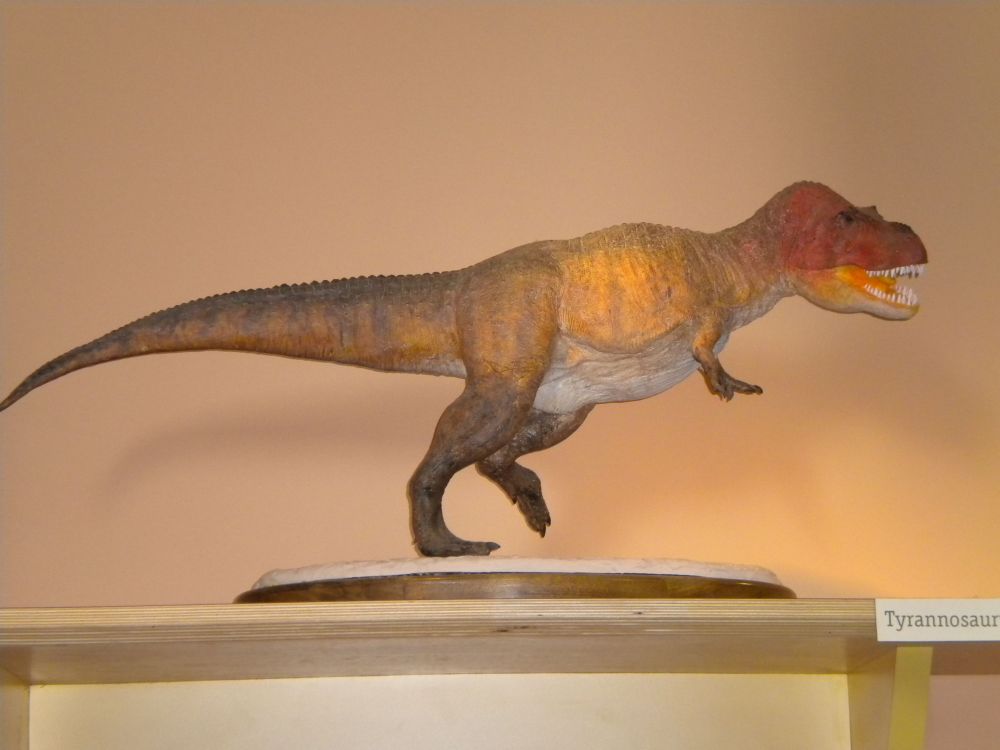
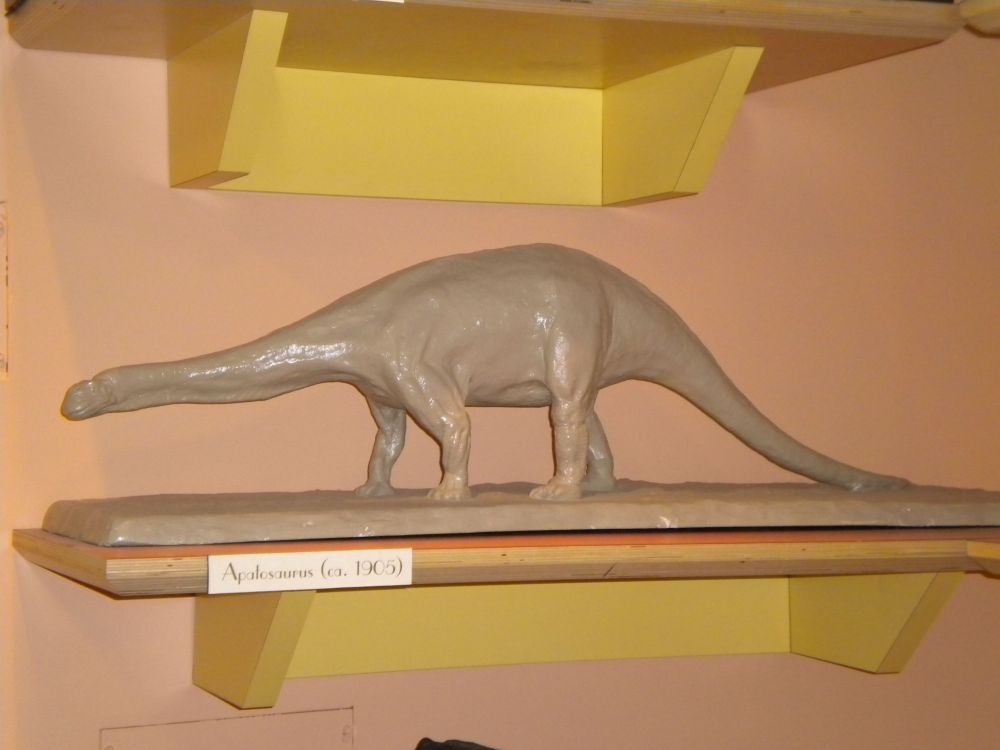
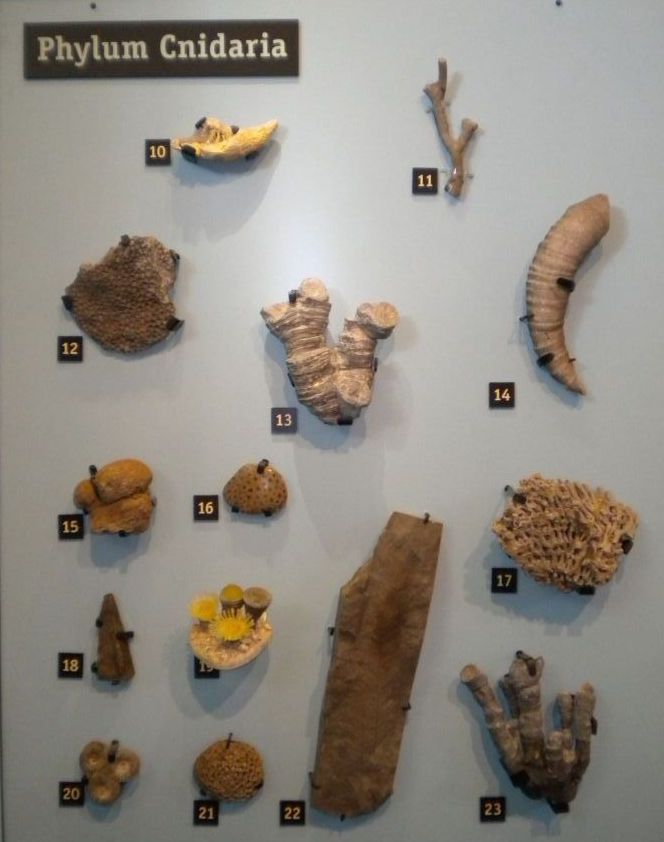
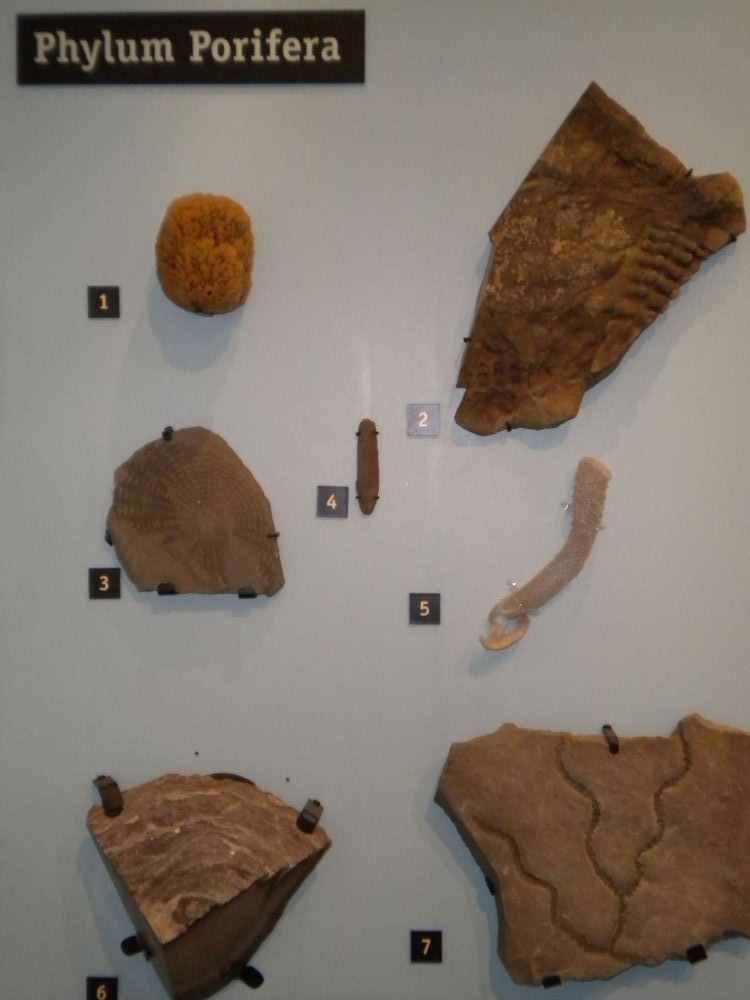
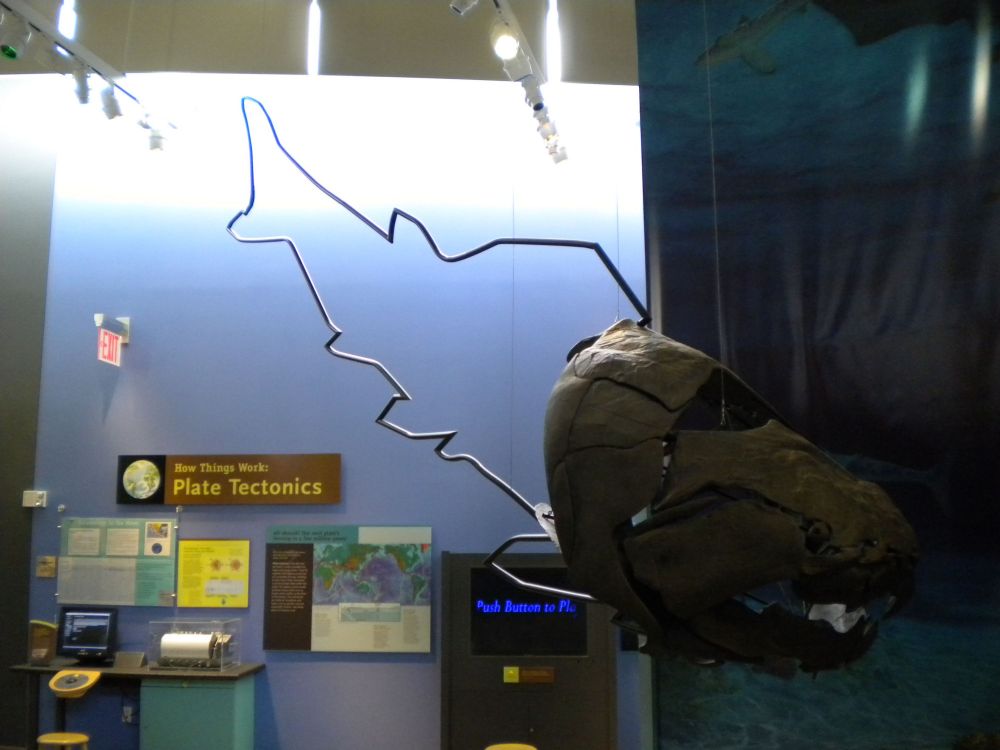
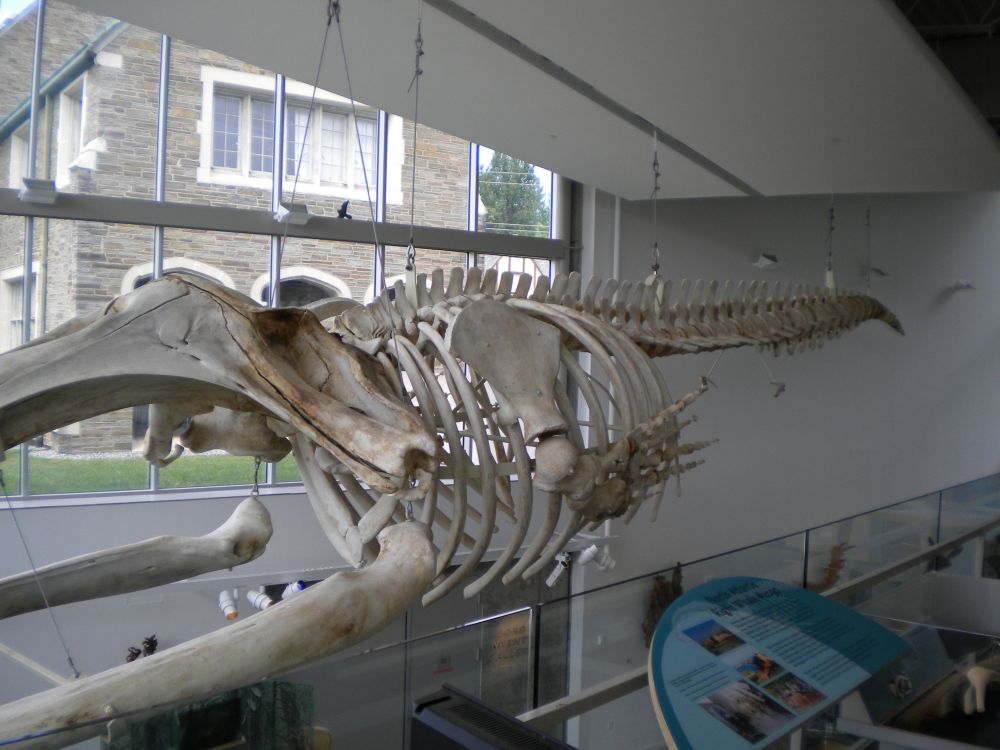
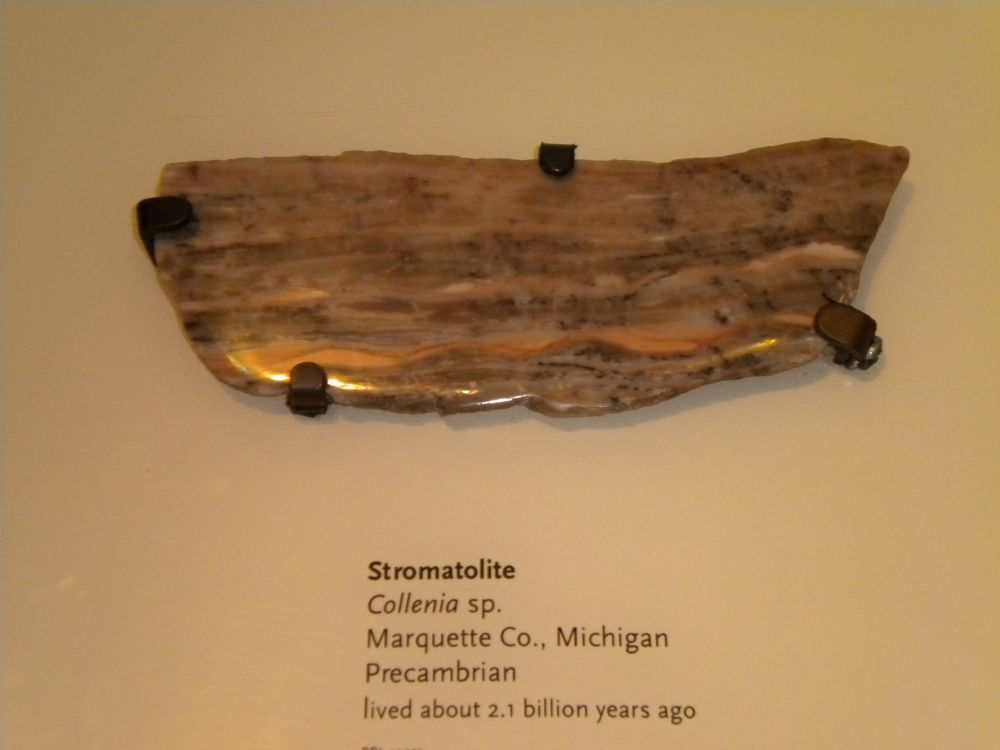
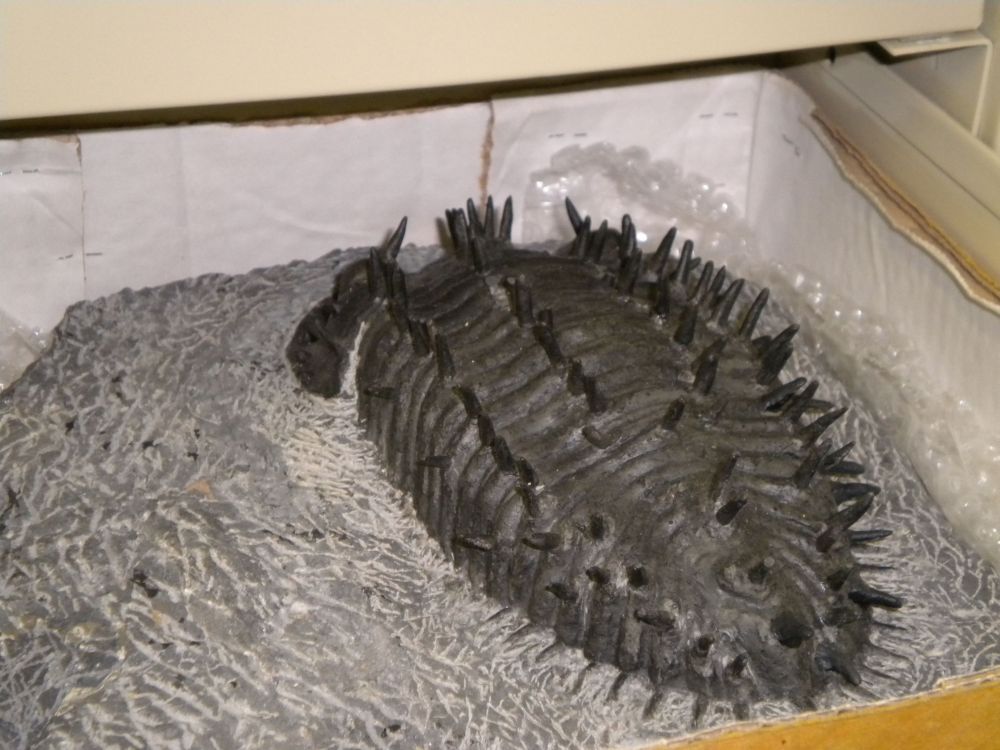
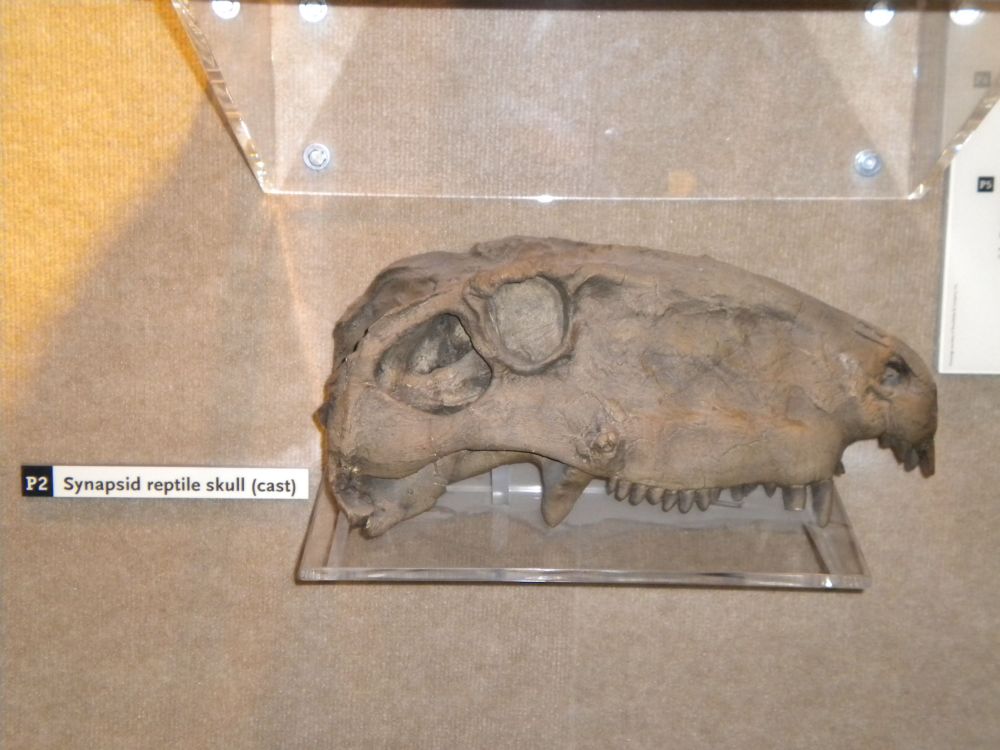
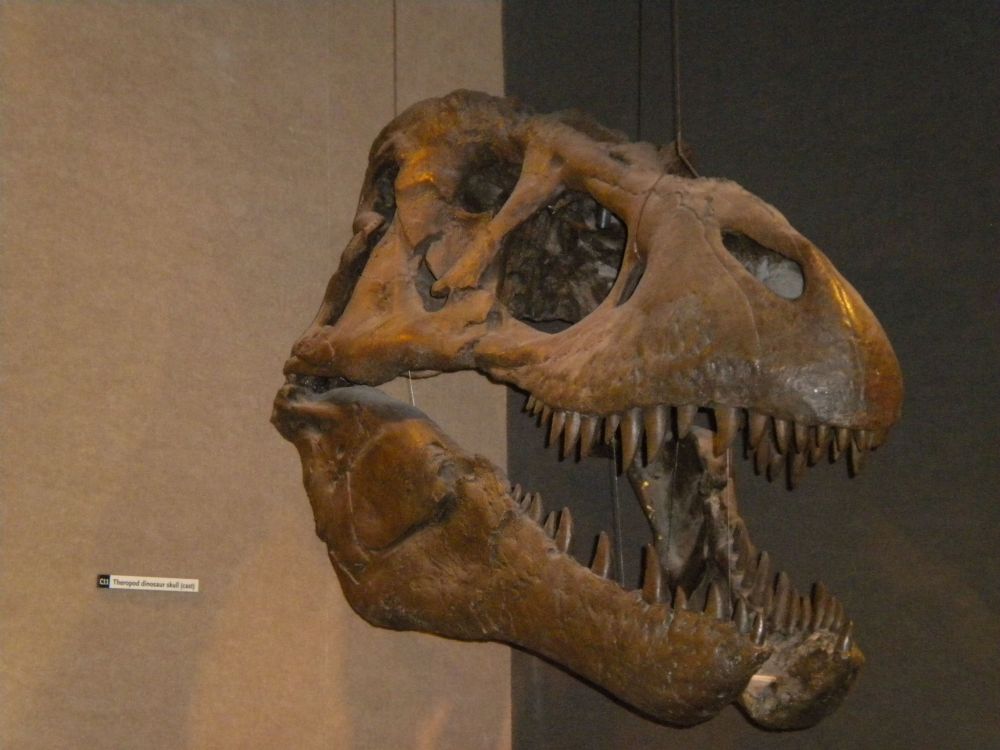
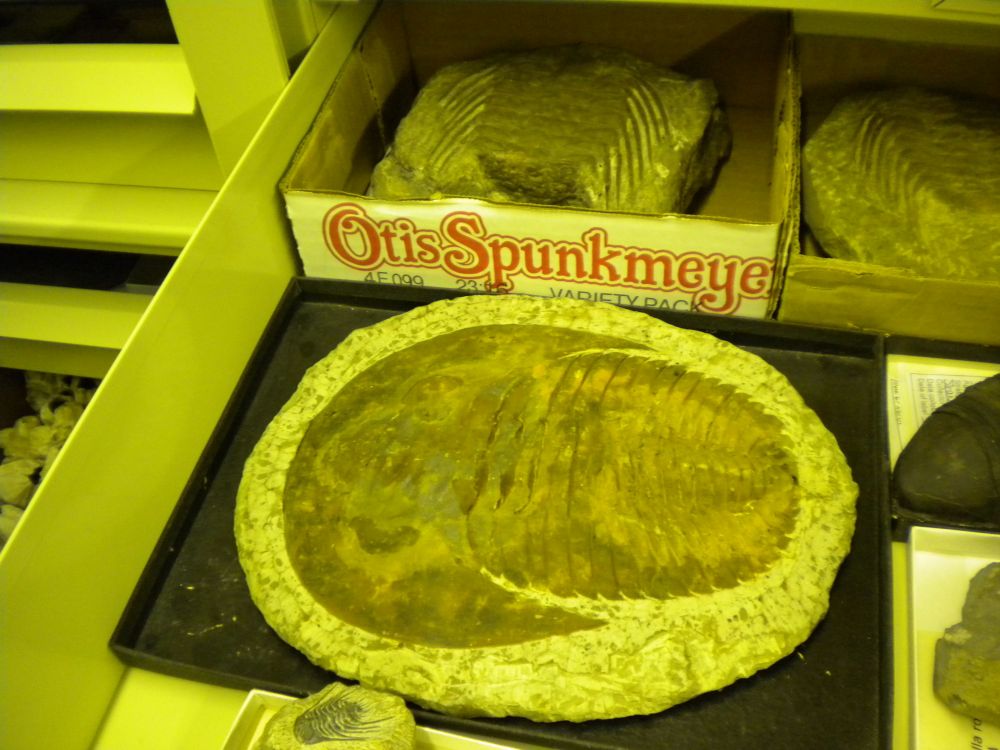
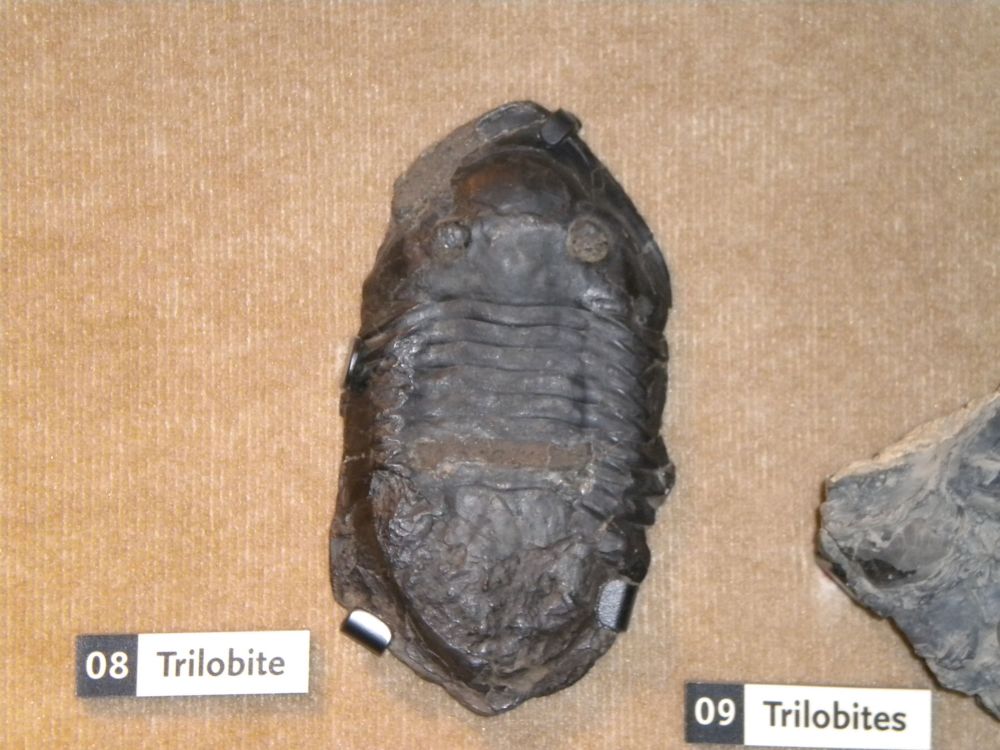
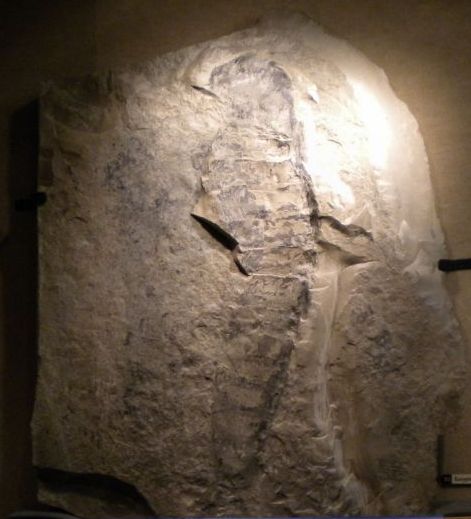
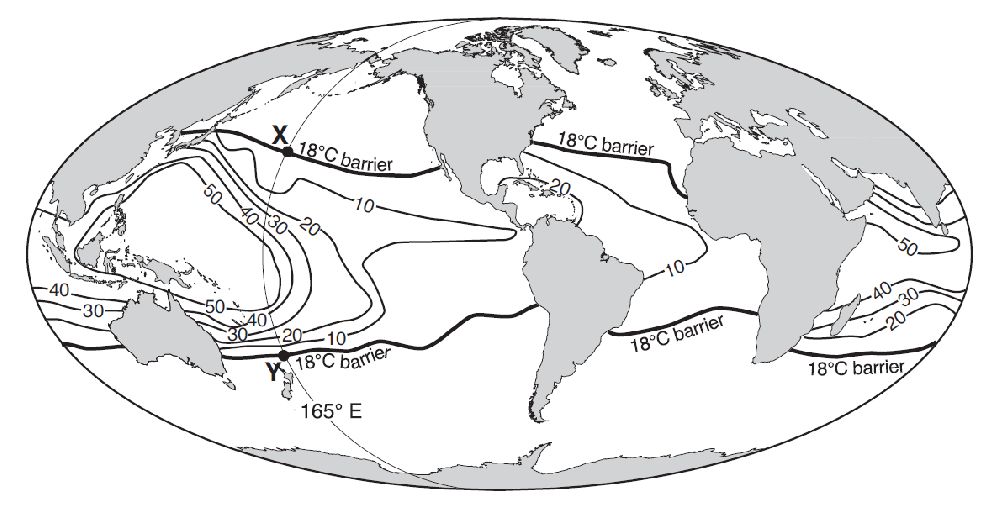
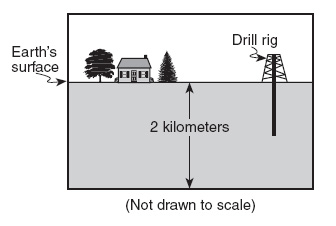
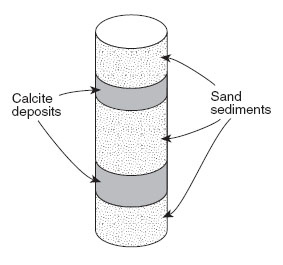
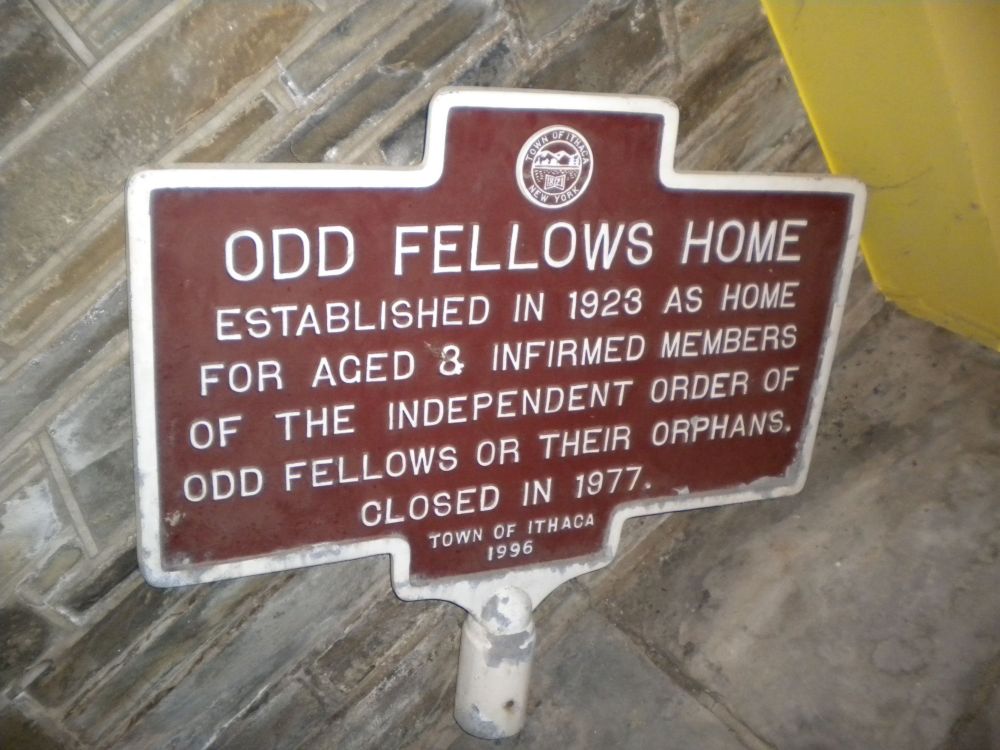
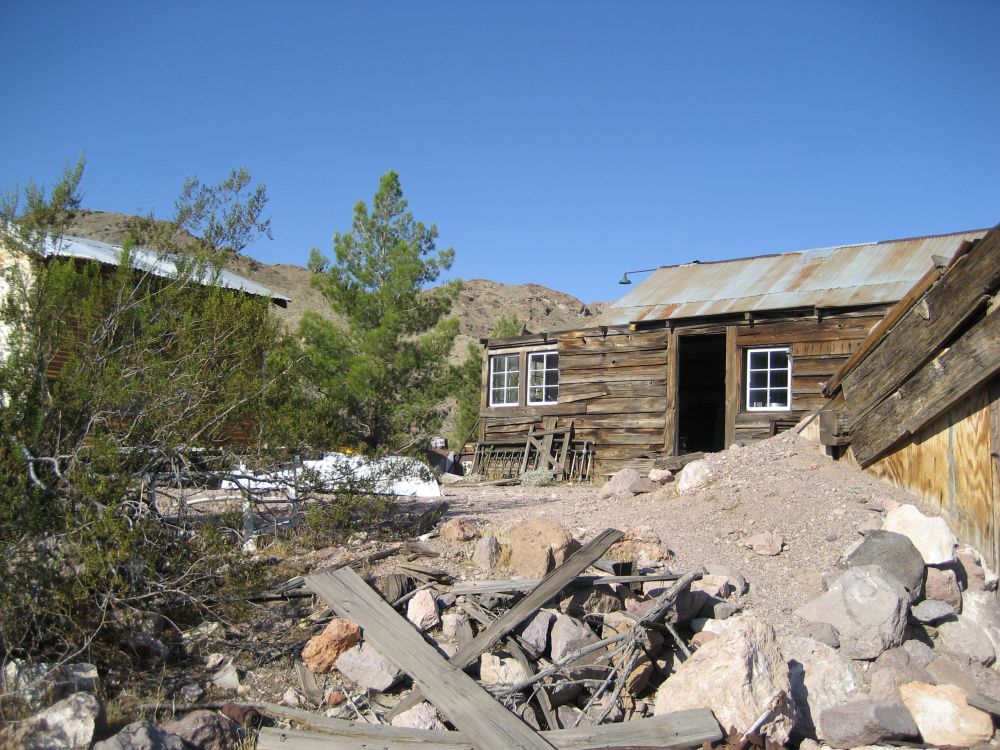
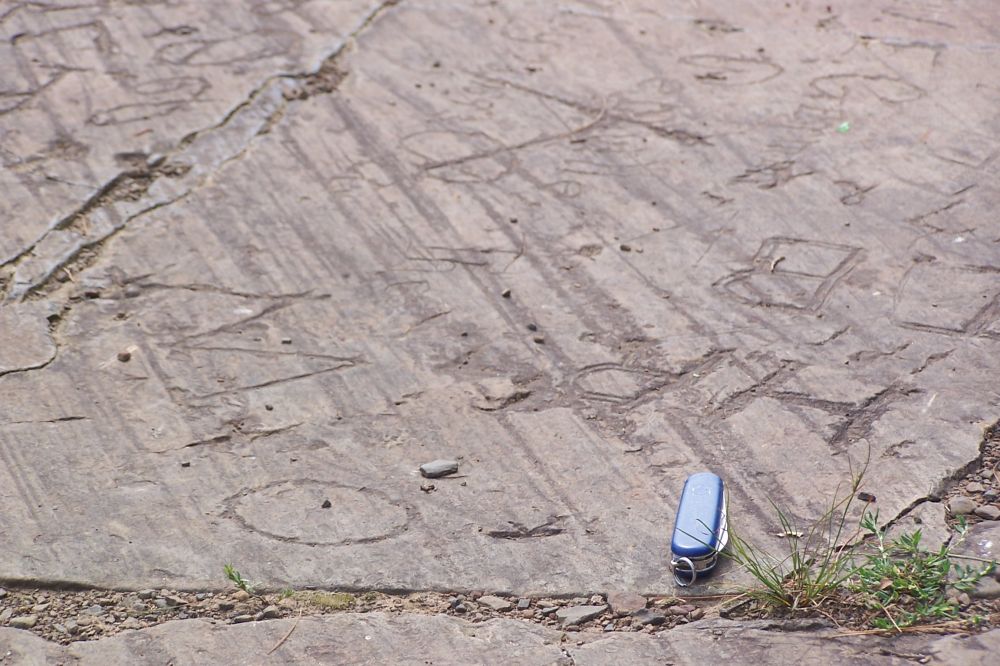
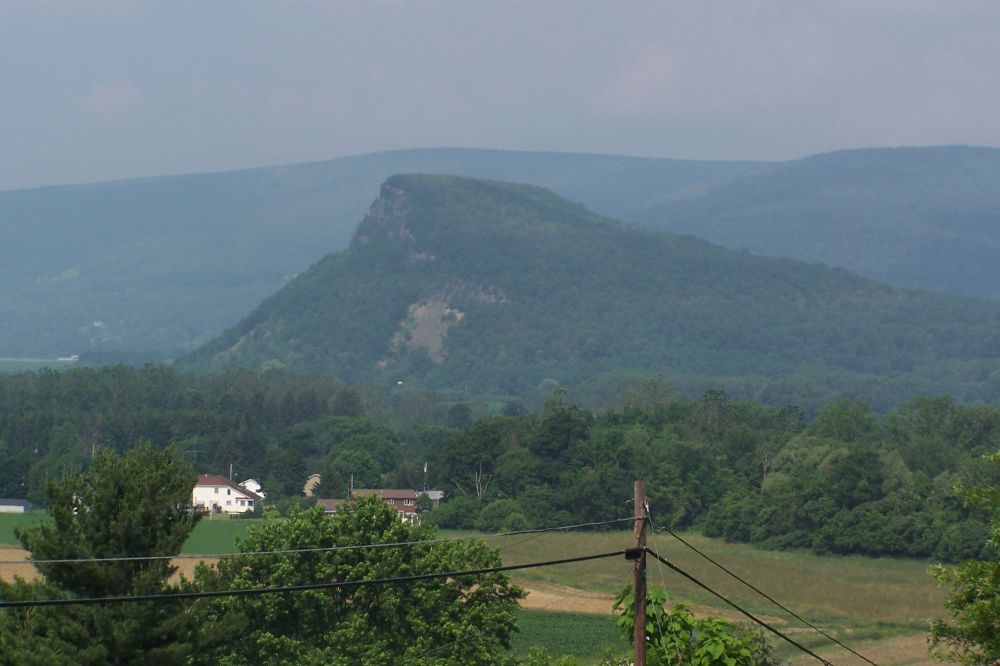
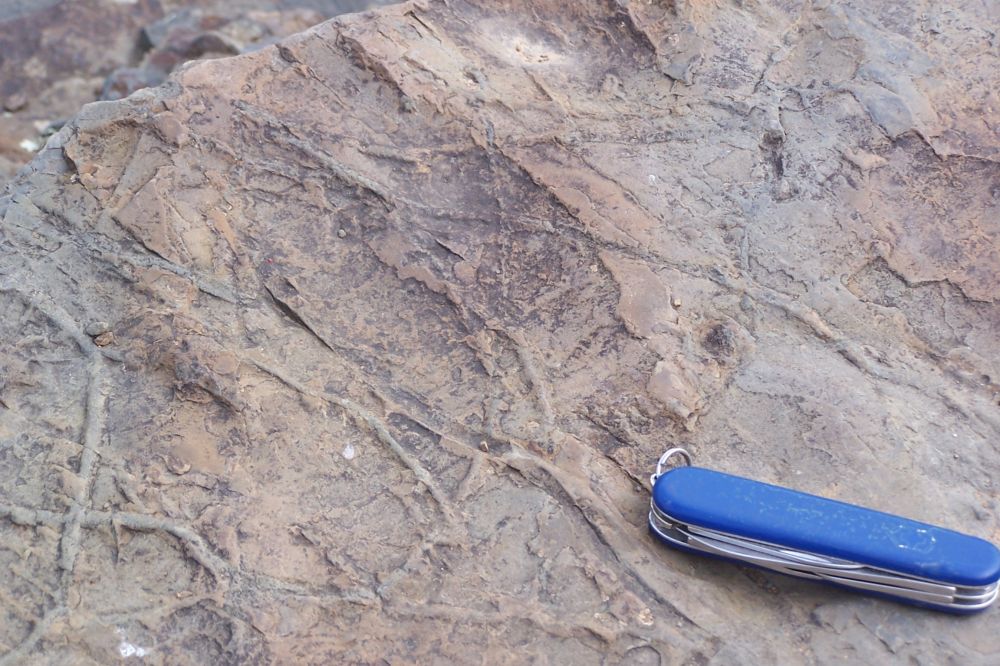
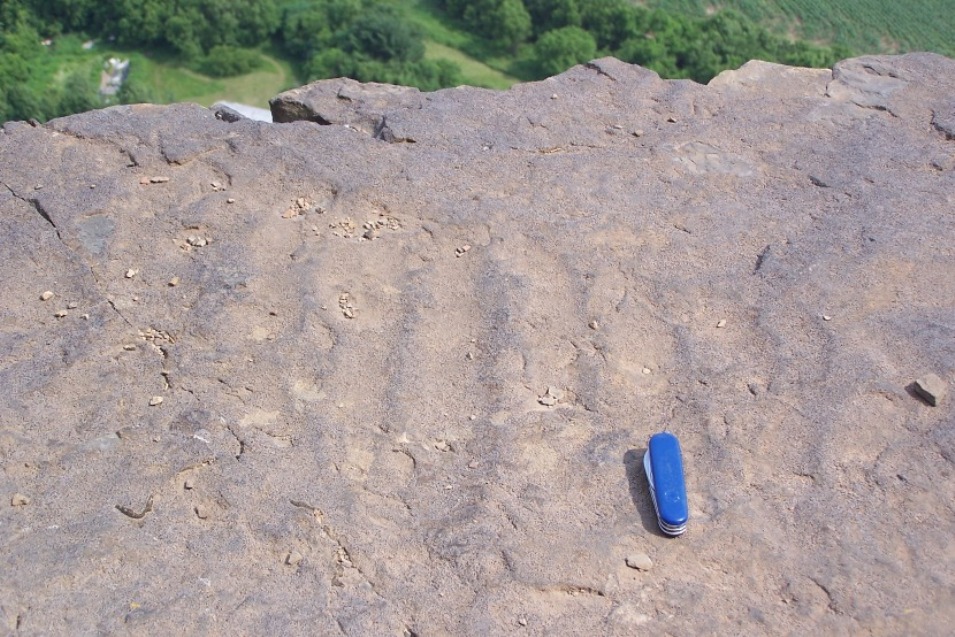
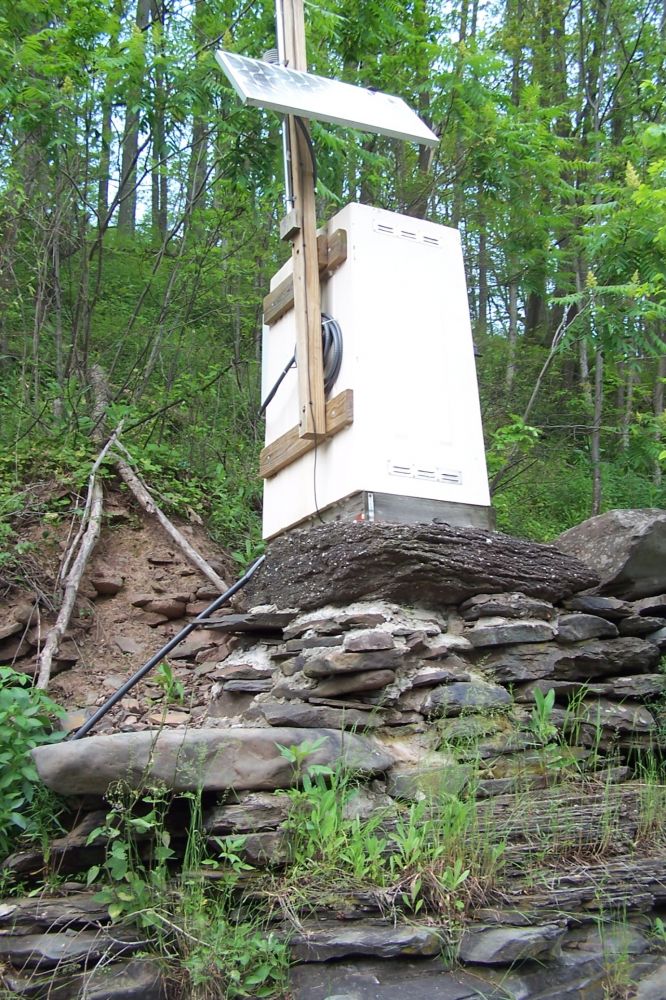
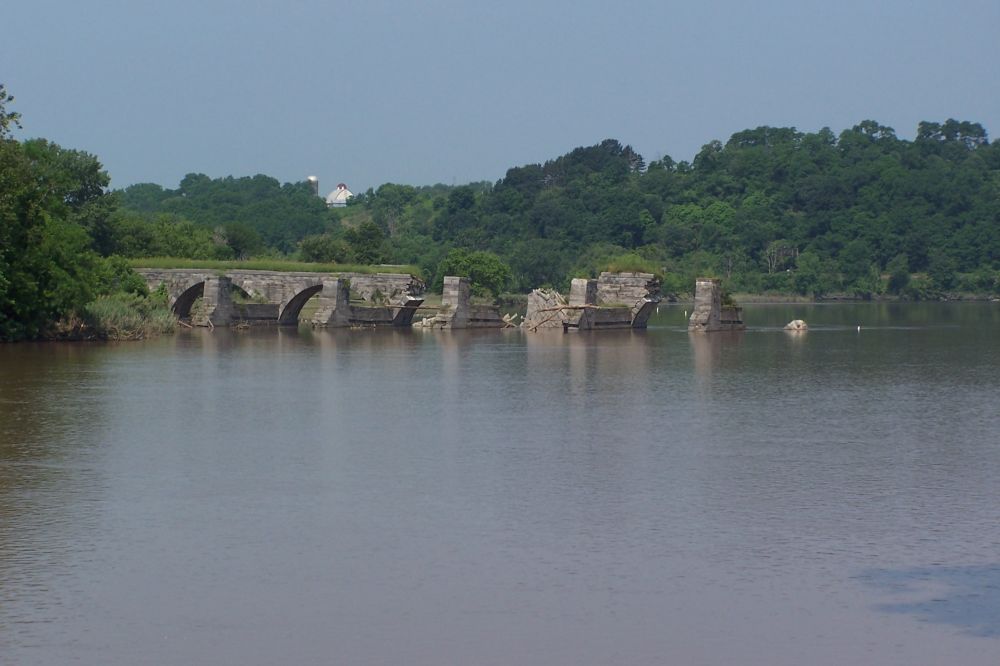
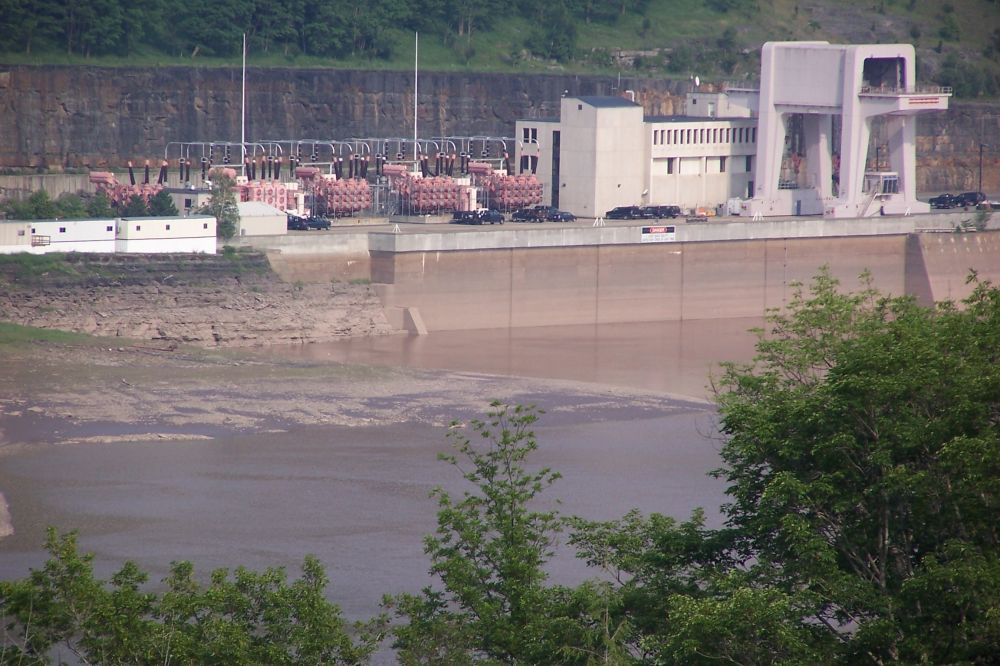
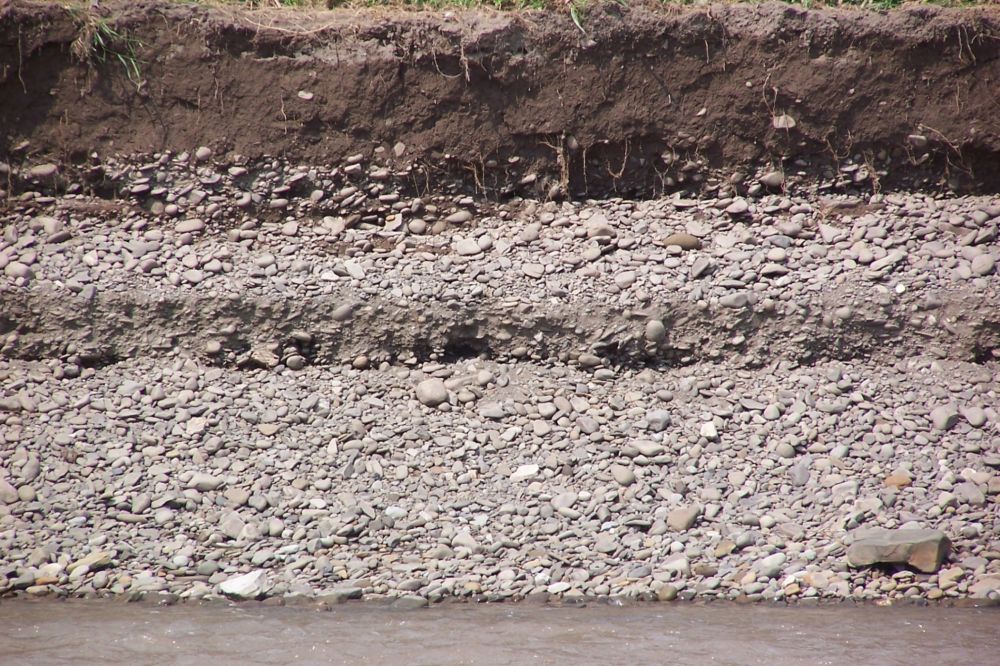
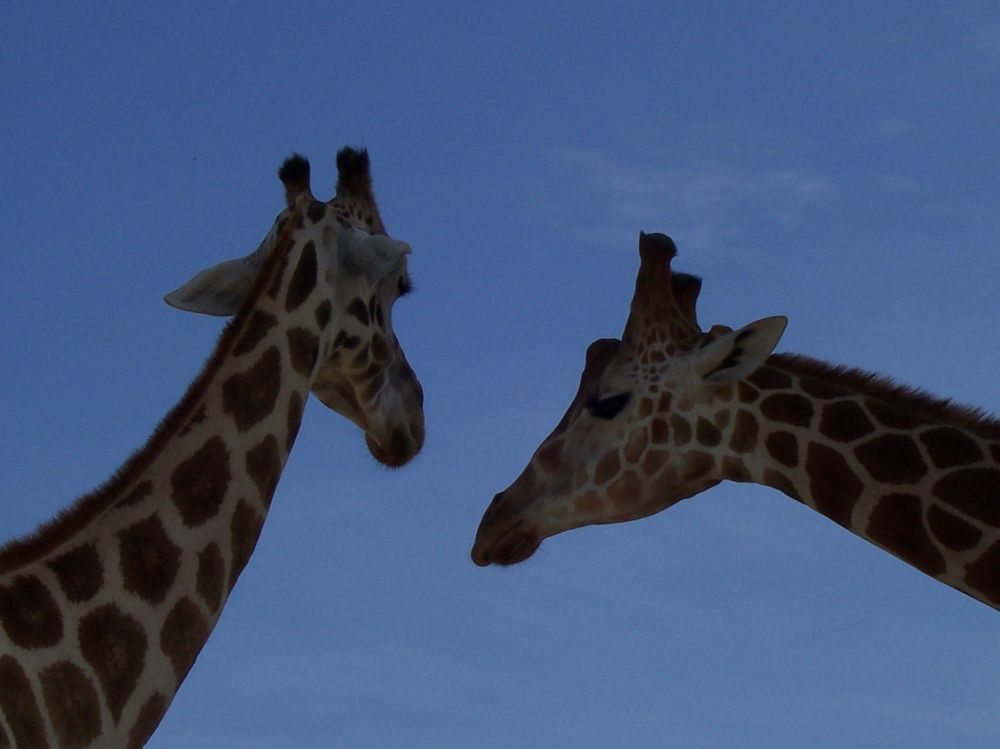
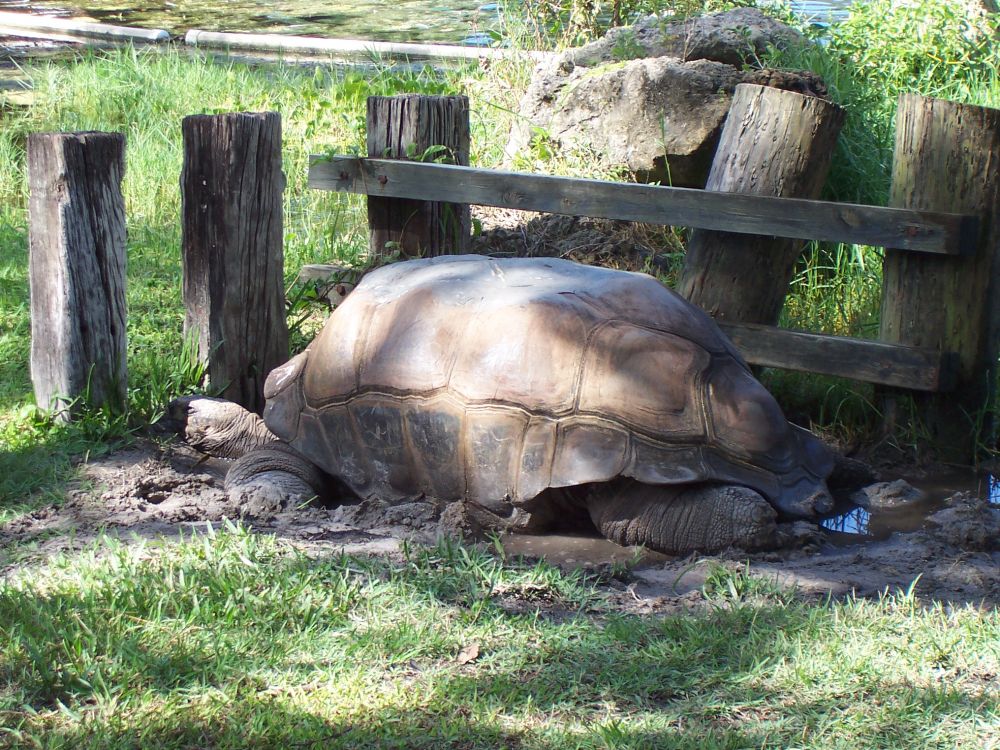
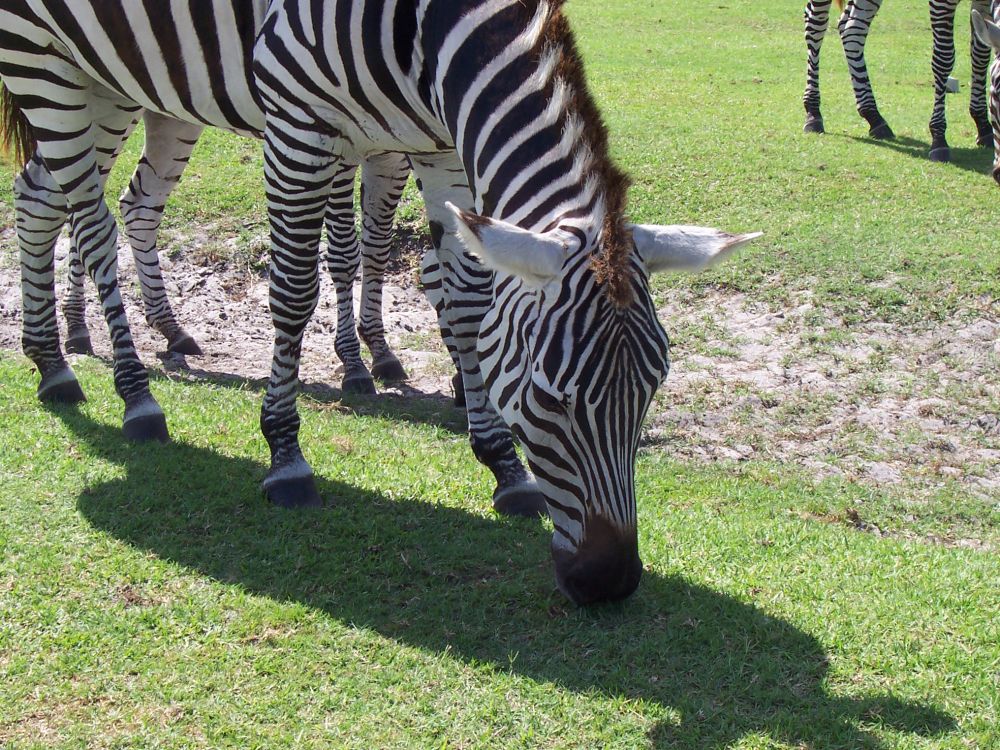
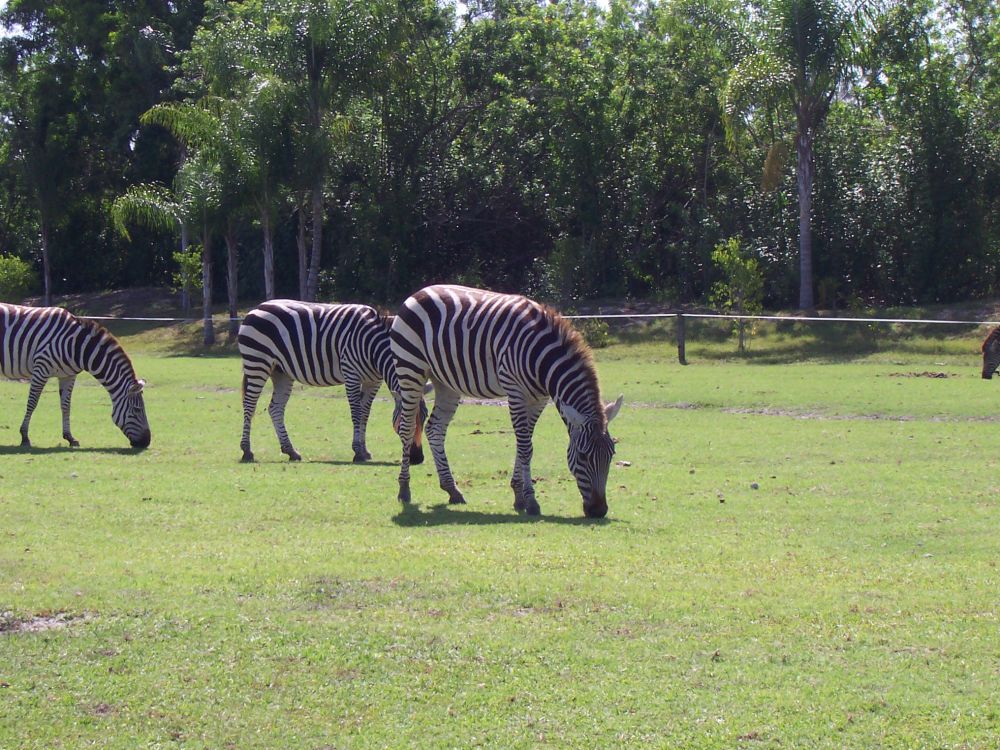
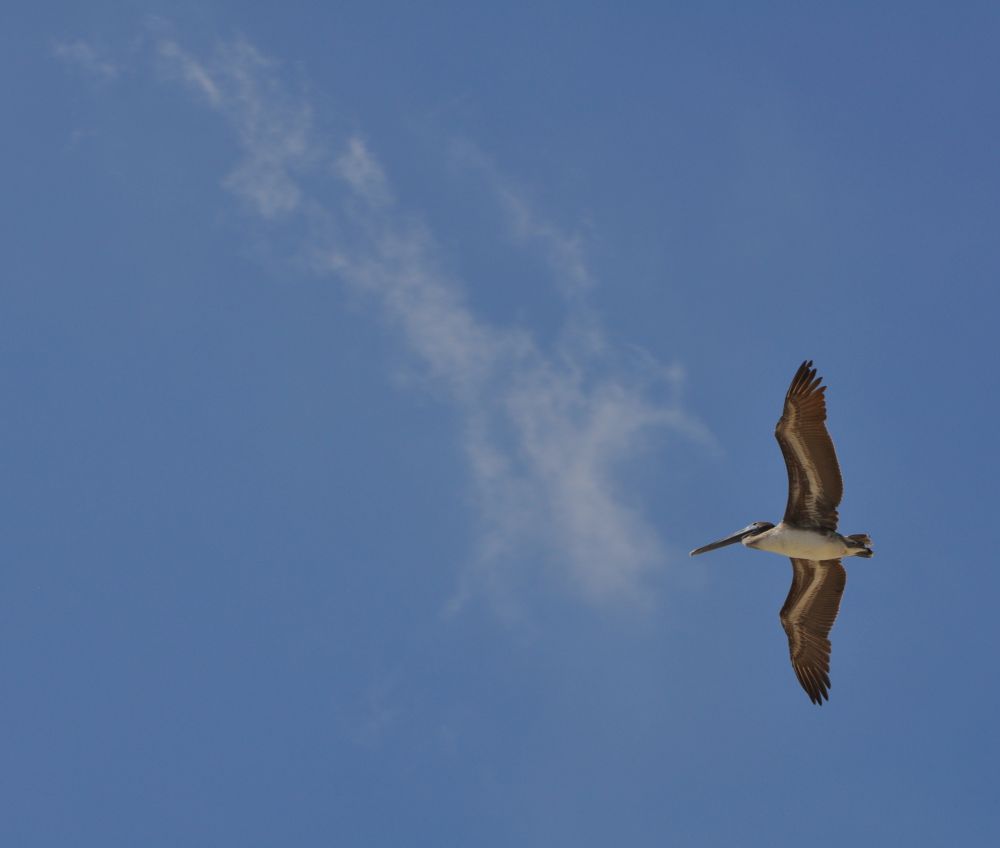
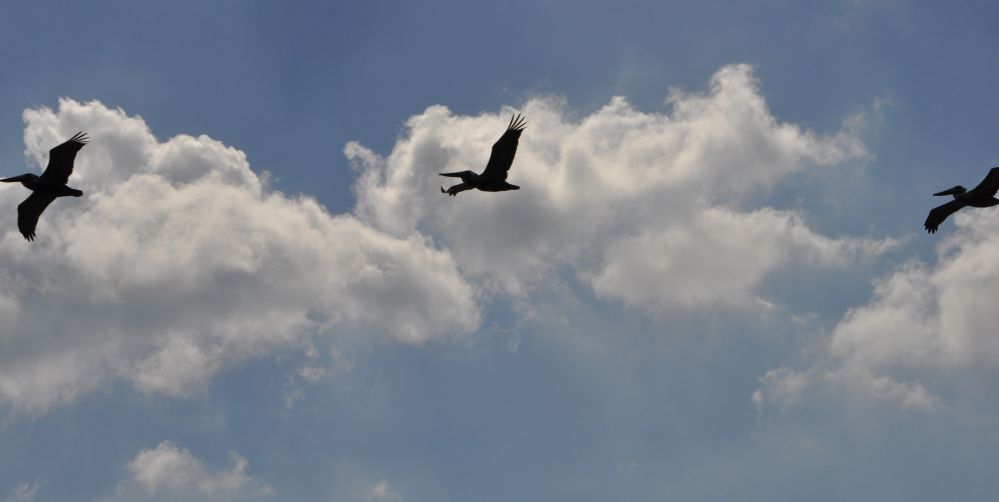
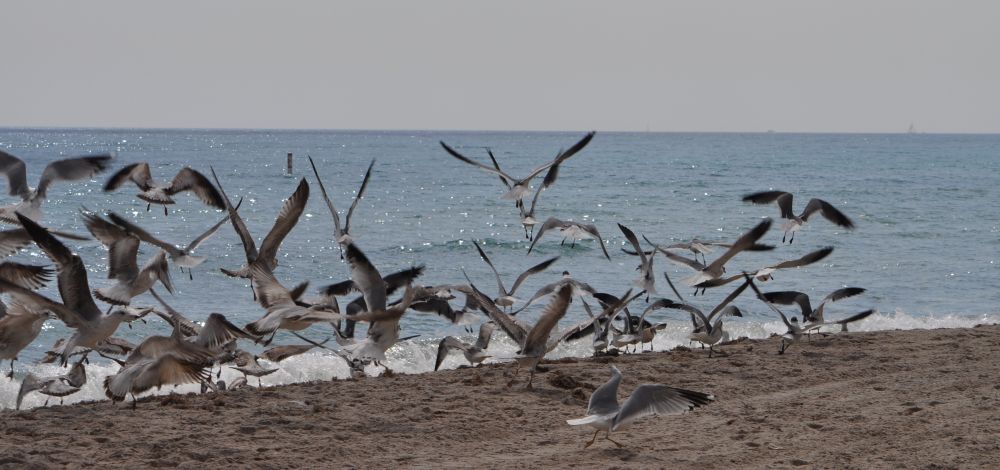
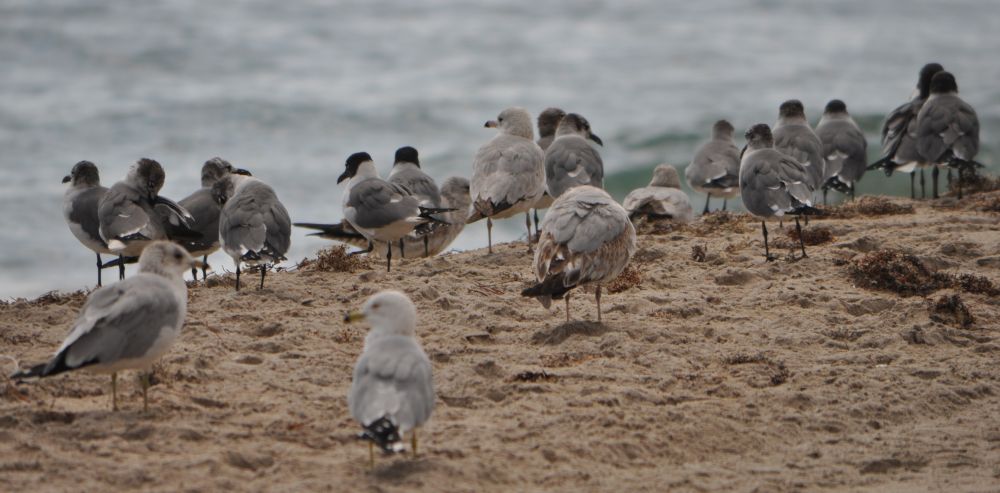
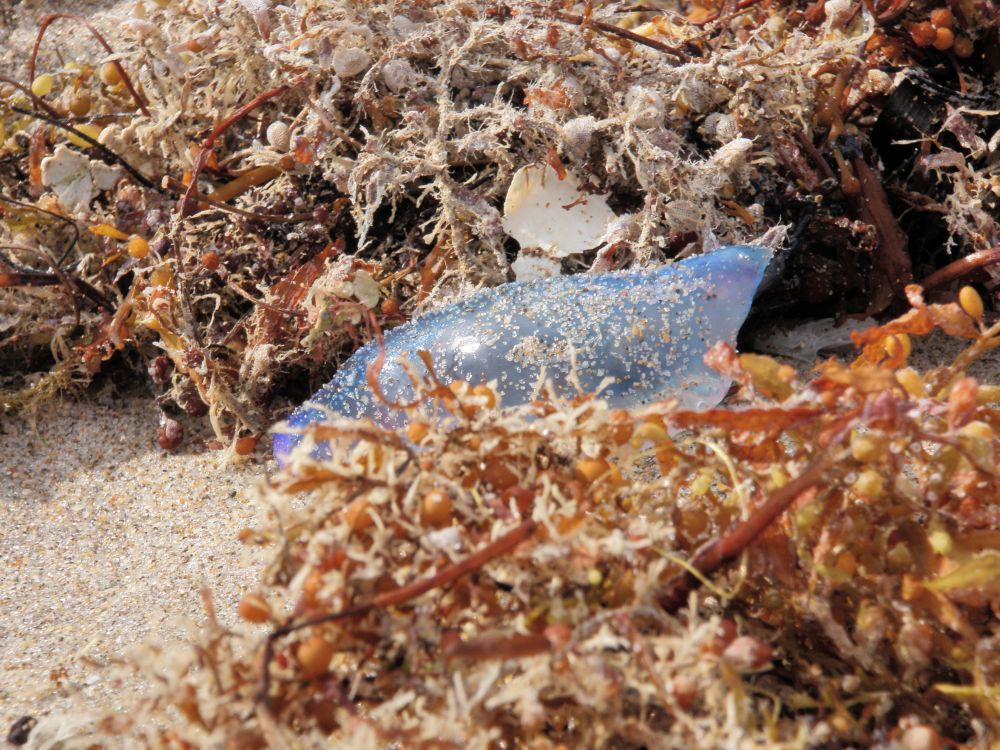
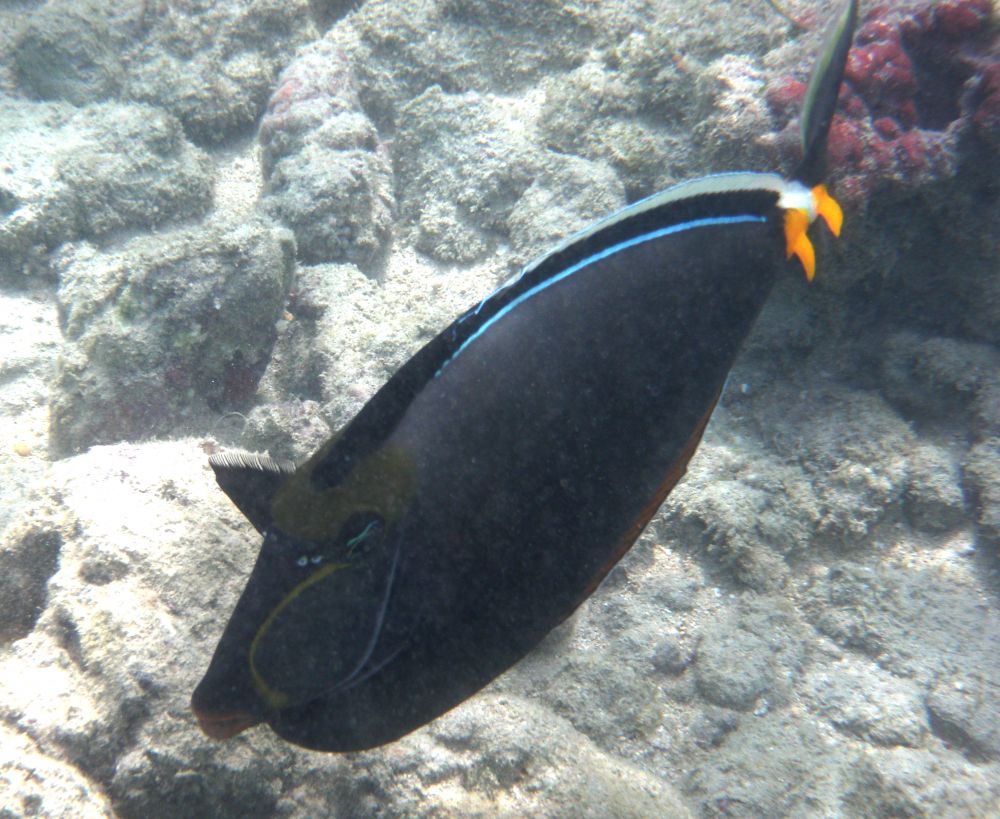
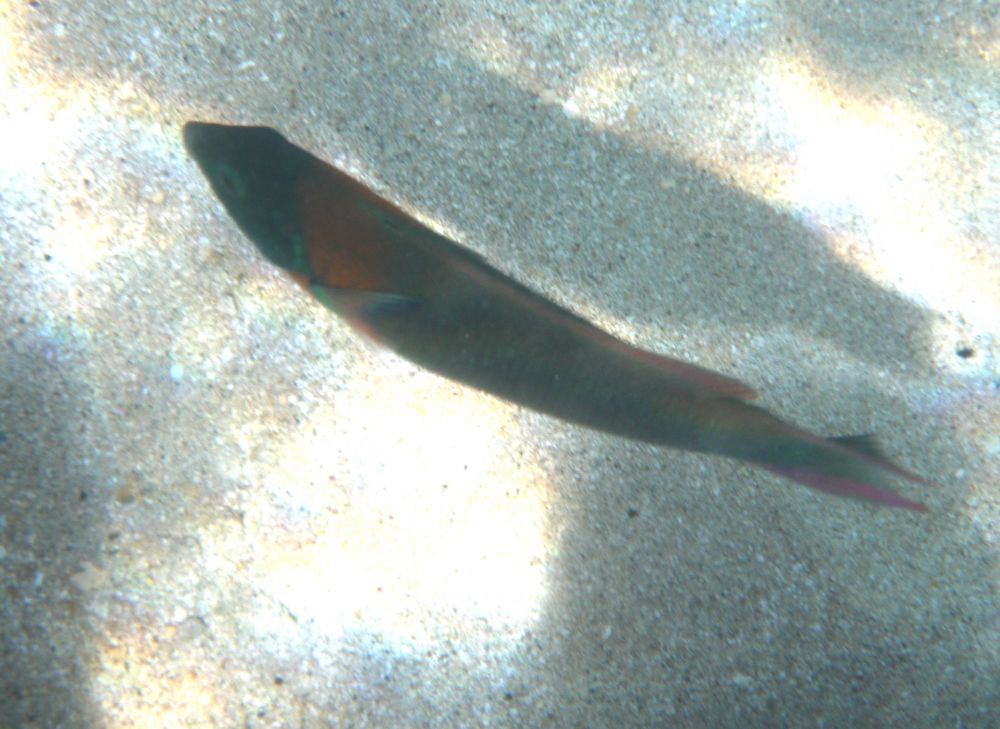
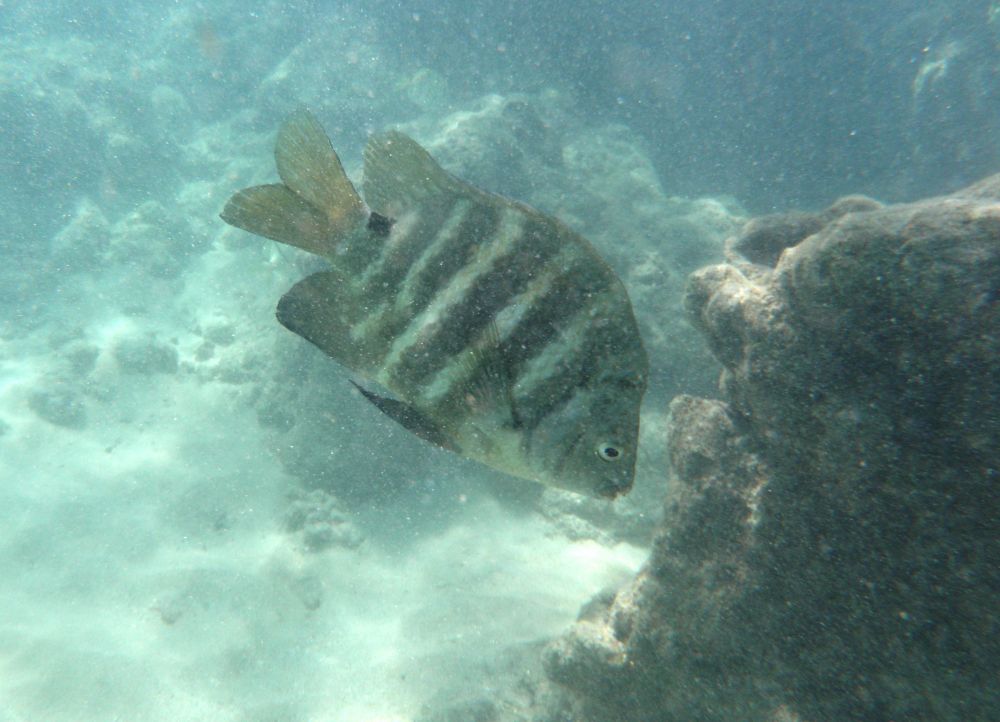
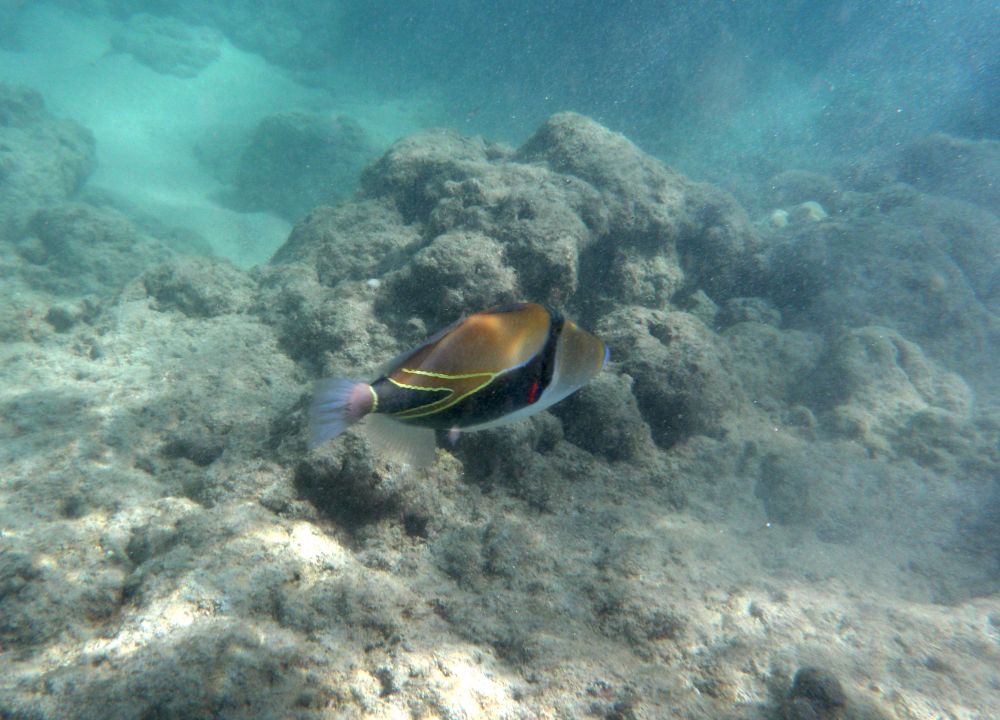
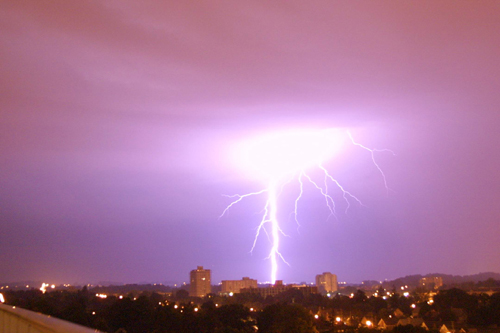
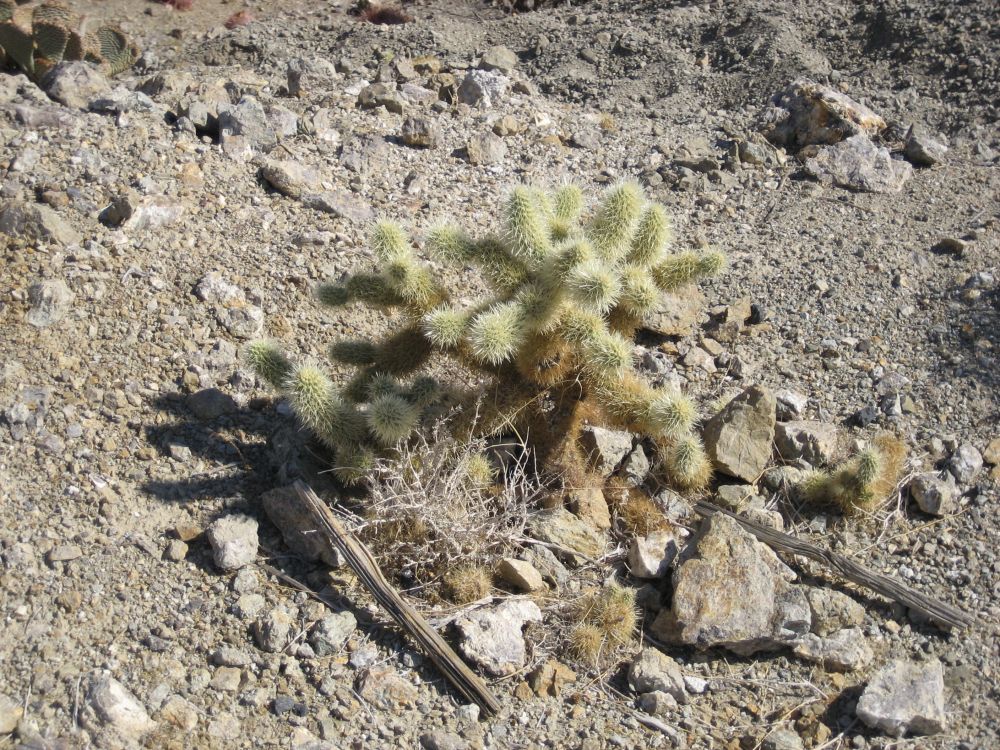
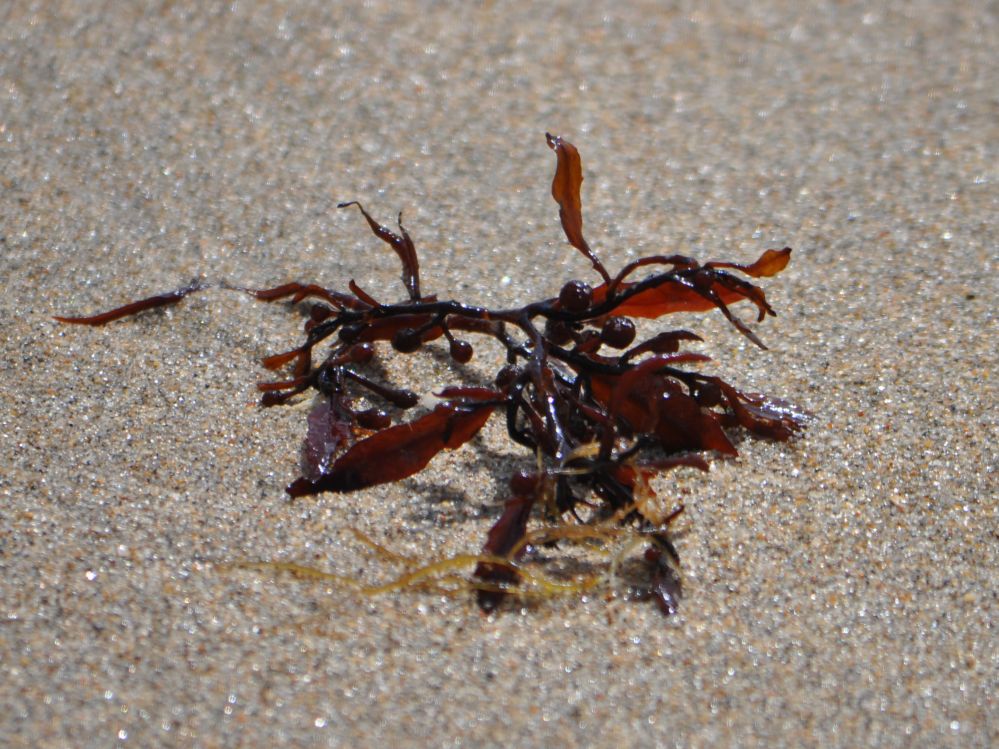
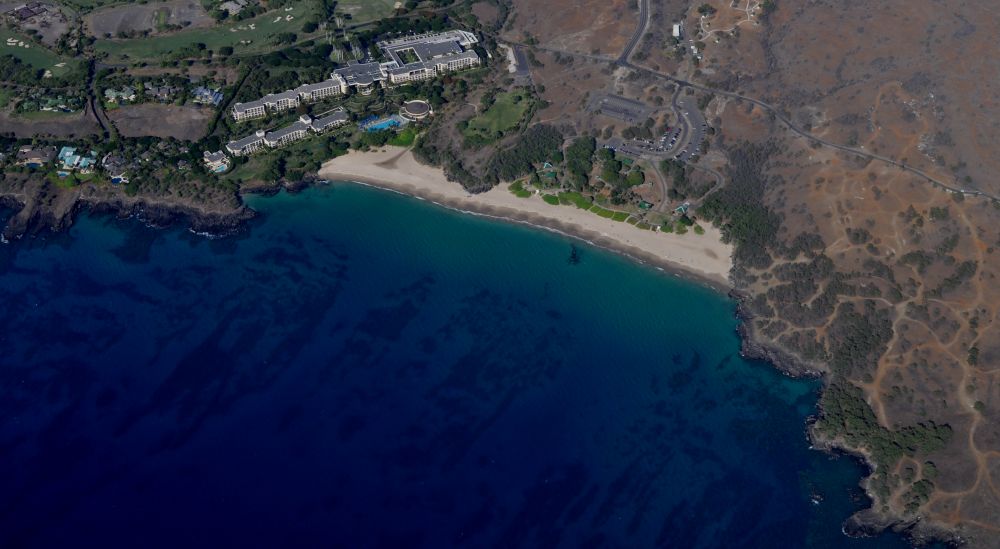
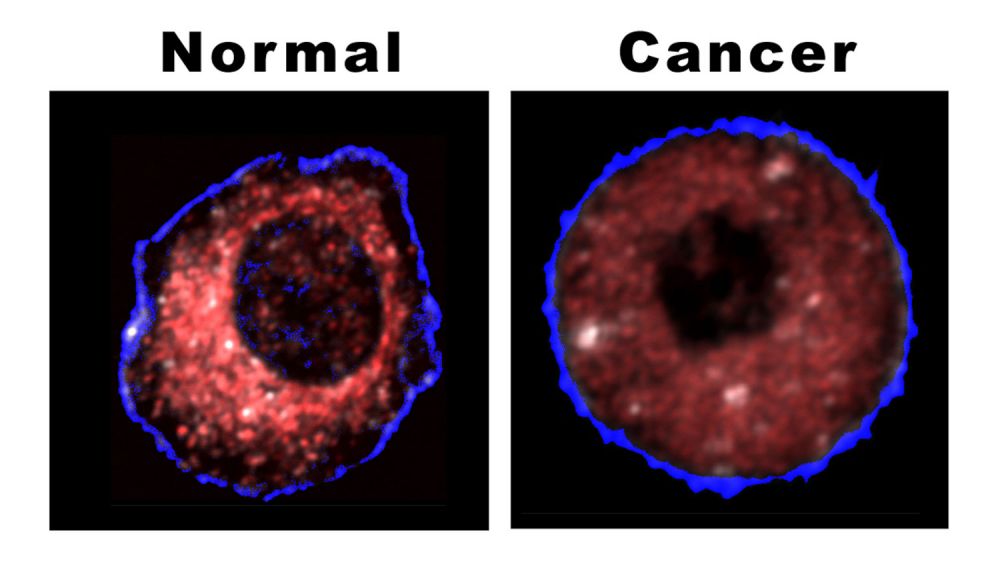
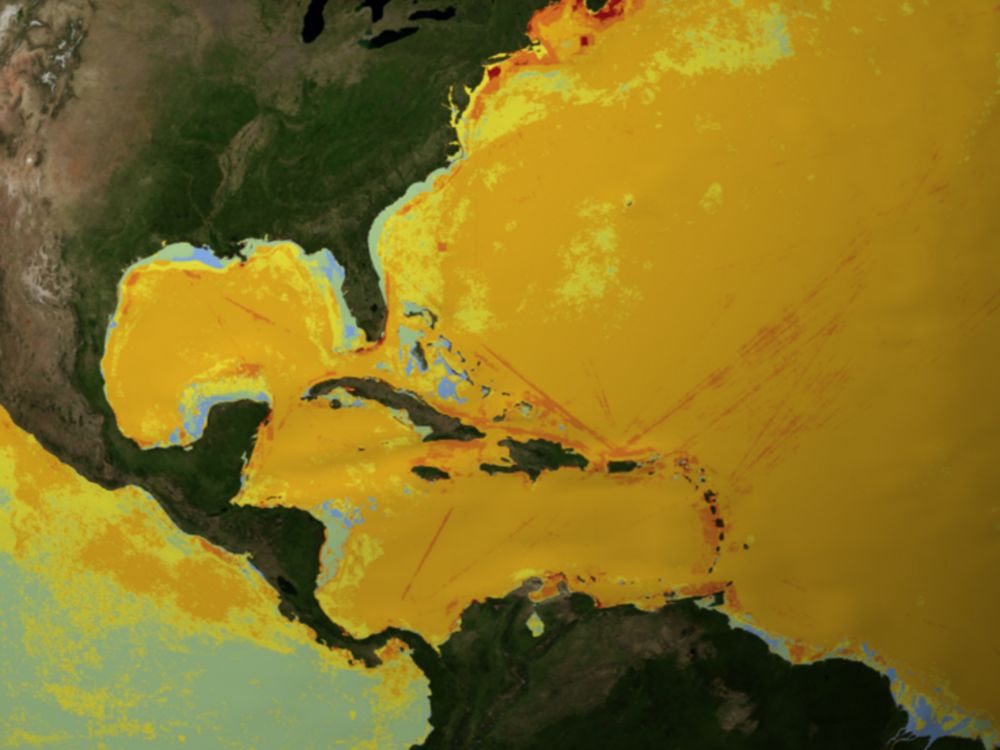